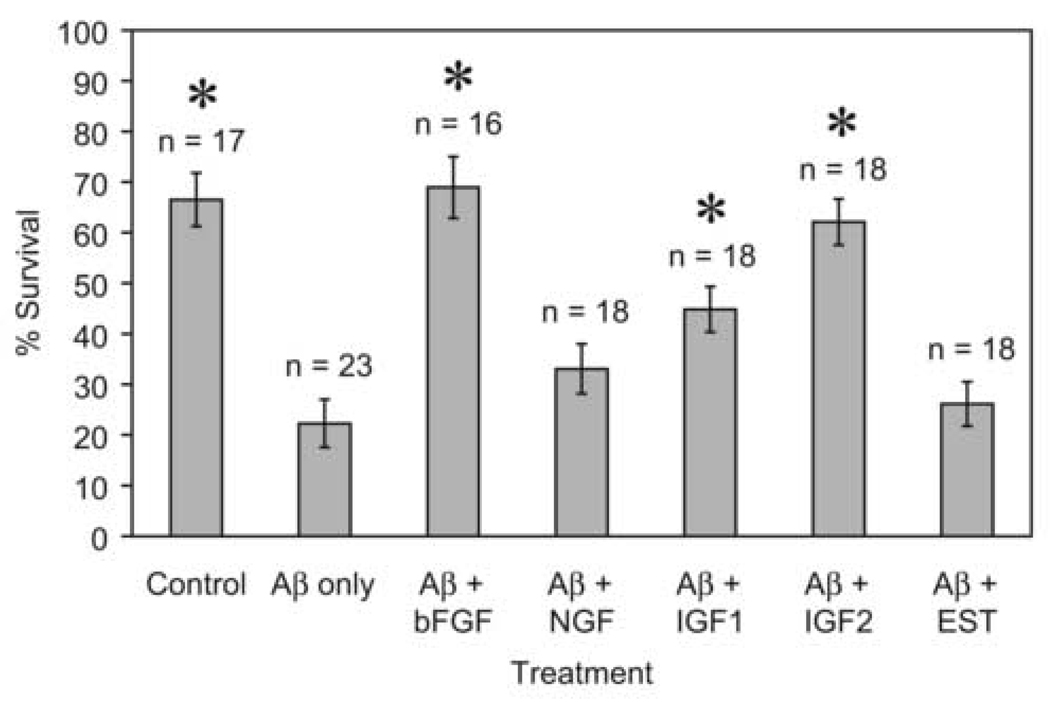
Figure 4.
Mean percent survival of cells per microscopic field (± 1 S.E.) exposed to different combinations of Aβ (10 µM) and growth factors (bFGF = 5 ng/ml, NGF = 100 ng/ml, IGF1 and IGF2 = 10 ng/ml, EST= 10 nM); n = number of fields counted, and * indicates treatment mean percent significantly higher than mean for Aβ only.

