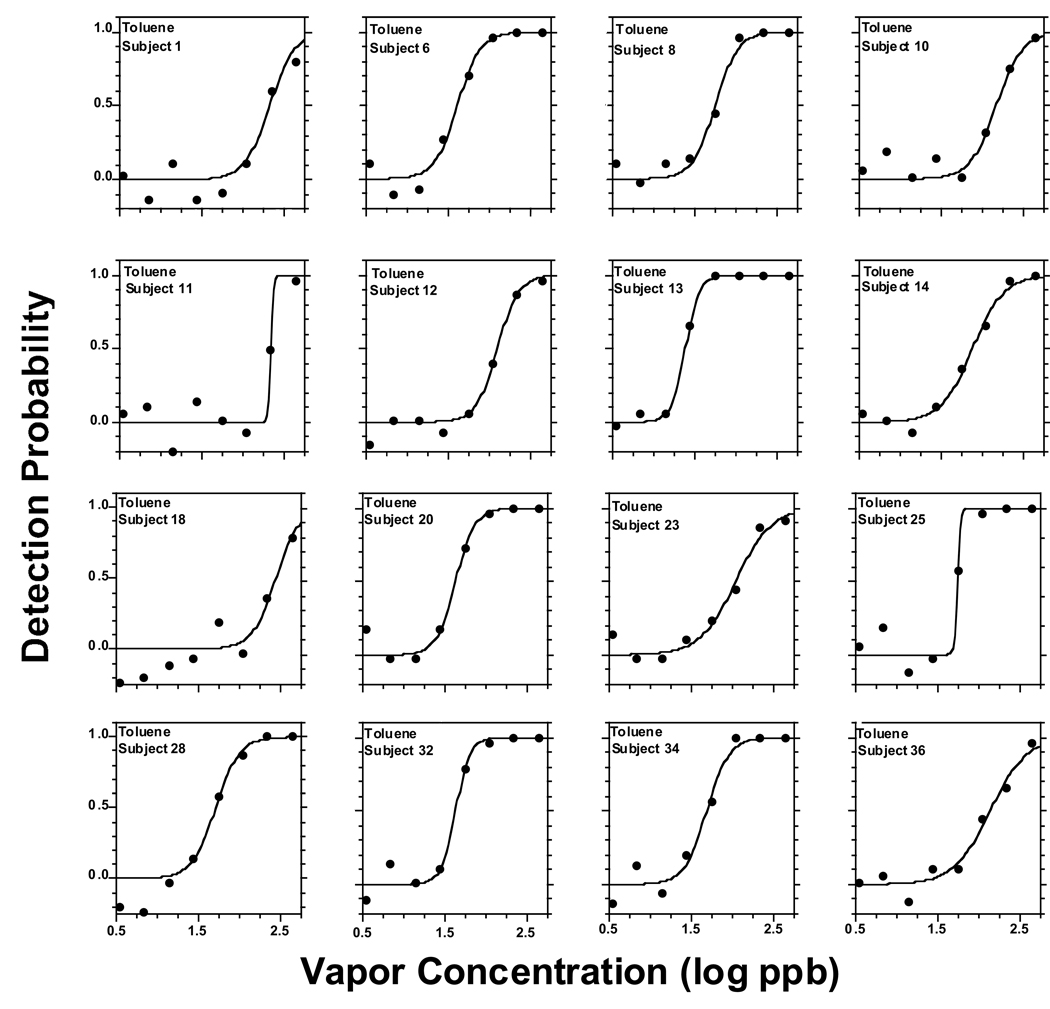
Figure 2.
Plots of individual psychometric odor functions for toluene, fitted by the sigmoid equation (2). Each point in a graph represents the outcome of 35 trials provided for that concentration by that subject. Each subject was given a unique number, so one can follow the performance of participants tested on more than one alkylbenzene.

