
Figure 3. Protease interactions with inhibitor 1 and darunavir.

3A. Polar interactions of inhibitor 1 with PR
The major conformation of inhibitor 1 is shown with interacting PR residues. Water is shown as red spheres. Hydrogen bond interactions are indicated by dotted lines, and CH…O interactions with main chain PR atoms by dashed lines. The H2OC O-H…π interaction with the P2′ aromatic ring is shown as a gray dotted line. The interactions of the alternate conformation of inhibitor are essentially the same.
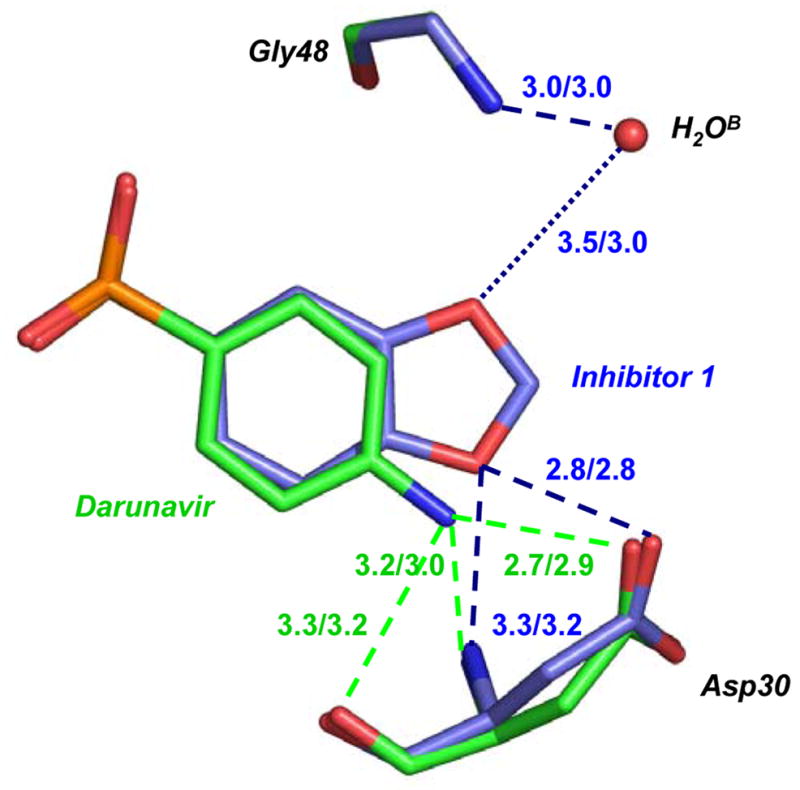
3B. Comparison of PR interactions with inhibitor 1 and darunavir.
Carbon atoms in PR/inhibitor 1 are colored in blue and those in PR/darunavir are green. The hydrogen bond interactions are indicated by the dashed lines, with distances in Å for the major/minor conformation of inhibitor, and colored blue for PR/inhibitor 1 and green for PR/darunavir. The dotted line indicates the water-mediated interaction with a weaker hydrogen bond for the major conformation.