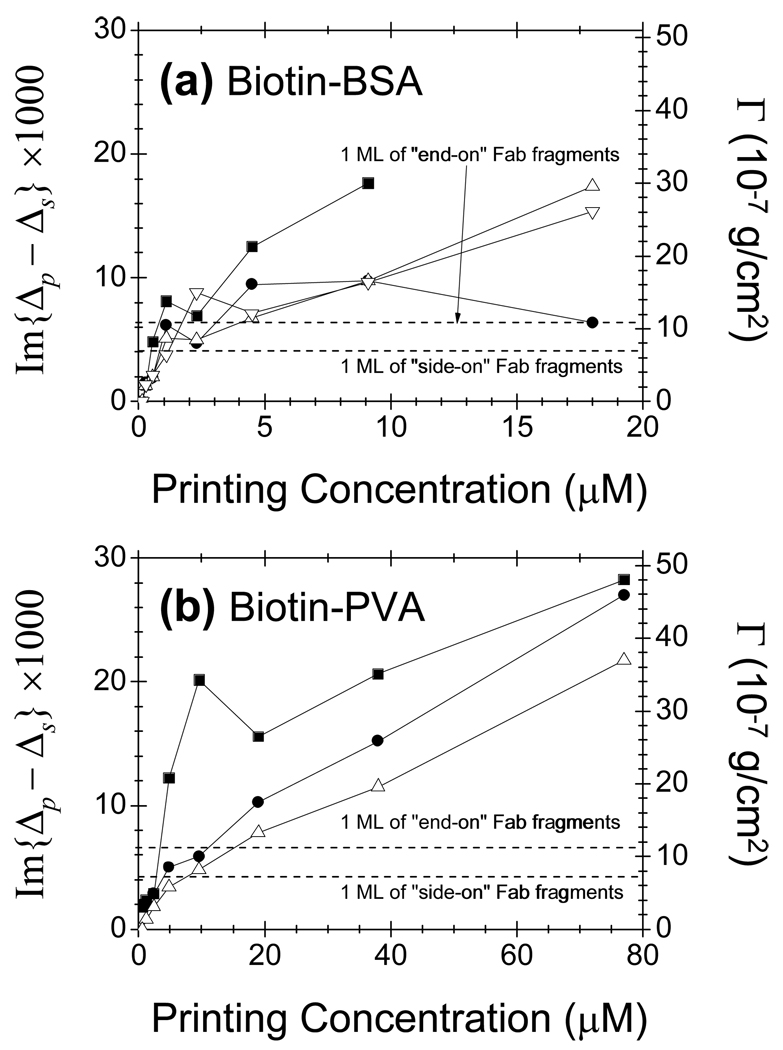
Fig. 4. Probe: Anti-Biotin.
Change in Im{Δp - Δs} vs. conjugated printing concentration due to captured Fab fragments of anti-biotin mouse IgG by (a) biotin-BSA and (b) biotin-PVA . For biotin-BSA conjugates: (1) solid squares: 40× loading; (2) solid circles: 20× loading; (3) open up-pointing triangles: 10× loading; open down pointing triangles: 5× loading. For biotin-PVA conjugates: (i) solid squares: 4% loading; (ii) solid circles: 2% loading; (iii) open up-pointing triangles: 1% loading. The optical signal was converted to surface mass density of the Fab fragments. Dashed lines correspond to a full monolayer of “side-on” and “end-on” Fab fragments.

