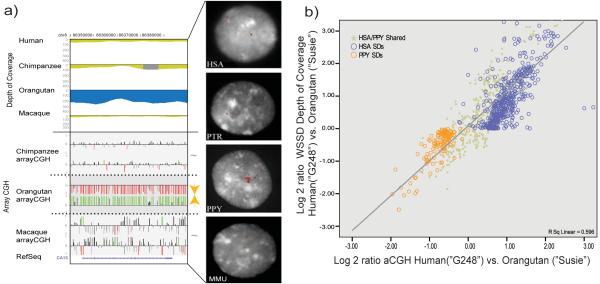
Fig. 1. Experimental validation of duplication map.
a) A computationally predicted orangutan-specific duplication (blue=excess depth of coverage of aligned WGS sequence) is confirmed by interspecific FISH and arrayCGH (oligonucleotide relative log2 ratios are depicted as red/green histograms and correspond to an increase and decrease in signal intensity when test/reference are reverse labeled) (see Supplementary Note for additional details). b) A comparison of duplication copy number as predicted by WSSD sequence analysis versus oligonucleotide arrayCGH between nonhuman and human primates showed a good correlation (r=0.77). Relative duplication copy number was computed as the log2 ratio of the number of aligned nonhuman primate reads against the human reference genome over the number of reads mapping to known single copy BACs.

