Figure 6.

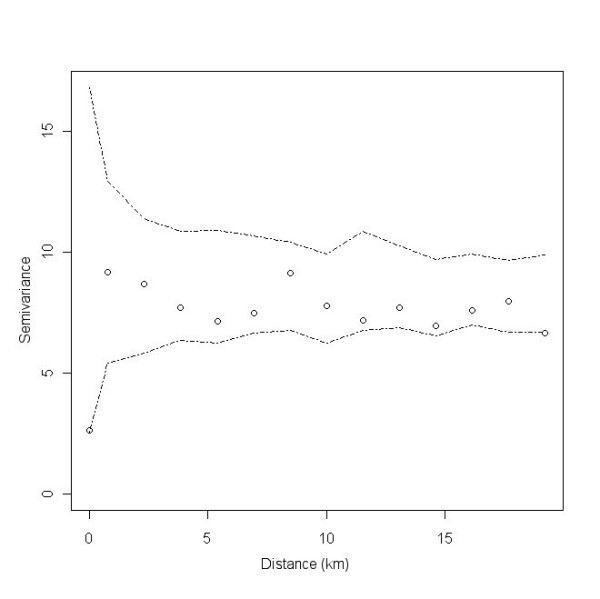
Empirical semivariogram with Monte Carlo simulation envelope (dotted lines) of the residuals of the mixed-effects logistic regression presented in Table 3.

Empirical semivariogram with Monte Carlo simulation envelope (dotted lines) of the residuals of the mixed-effects logistic regression presented in Table 3.