
Figure 4.
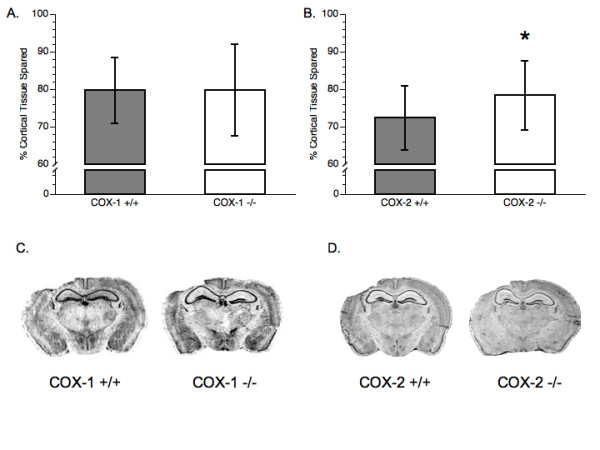
Tissue sparing analysis. (A) Comparison of cortical tissue loss between COX-1 +/+ mice and COX-1 -/- mice. (B) Comparison of cortical tissue loss between COX-2 +/+ mice and COX-2 -/- mice. (C) Pictorial representation of cortical tissue sparing following CCI in COX-1 +/+ and COX-1 -/- mice. (D) Pictorial representation of cortical tissue sparing following CCI in COX-2 +/+ and COX-2 -/- mice. (*) Represents significance from wild-type controls (P < 0.05). Data presented as mean ± SD.