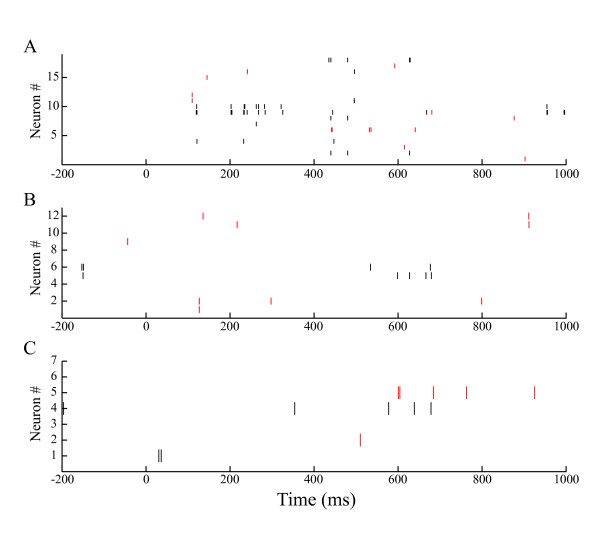
Figure 4.
Raster plots of hippocampal activity. Typical raster plots of raw spiking activity of hippocampal ensembles #1 (A), #2 (B), and #3 (C) on match (red) and non-match (black) trials during the test period (0-1,000 ms) in a single session. Red and black bars respectively show spikes on match and non-match trials.

