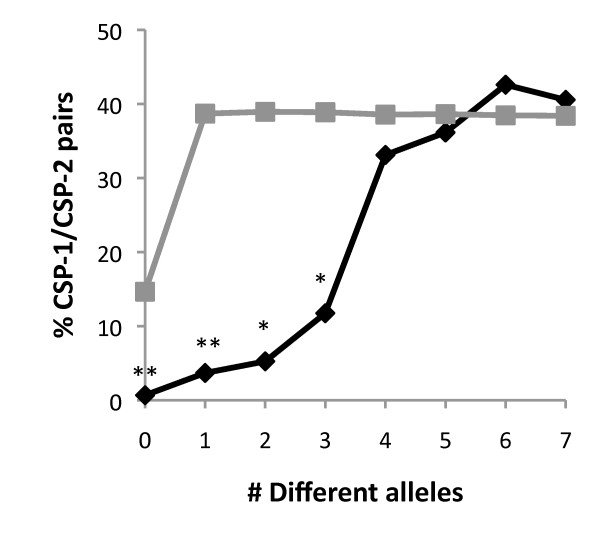
Figure 1.
Probability of pairs of isolates with different alleles to belong to different pherotypes. The black line indicates the fraction of observed CSP-1/CSP-2 pairs differing at the indicated number of alleles and the grey line the expected number if there was a random association between pherotype and sequence type. As the allelic differences increase, the probability of diverging in pherotype also increases reaching levels undistinguishable from those expected by chance when strains differ in more than three alleles. One asterisk, p < 0.01 and two asterisks, p < 0.001.

