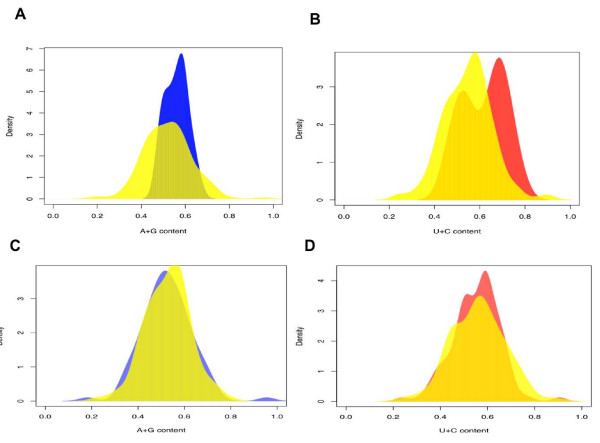
Figure 3.
Sequence features of human miRNA strand selection: purine/pyrimidine bias. (A) Purine content of the high-expressed strand from 33 miRNA pairs with large strand selection bias (blue) and the high-expressed strand from all other expressed miRNA pairs (yellow). (B) Pyrimidine content of the low-expressed strand from 103 miRNA pairs with little strand selection bias (red) and the low-expressed strand from all other expressed miRNA pairs (yellow). Purine (C) and pyrimidine (D) content of high- and low-expressed strands from 103 miRNA pairs with little strand selection bias. Colour labels as on panels (A) and (B).

