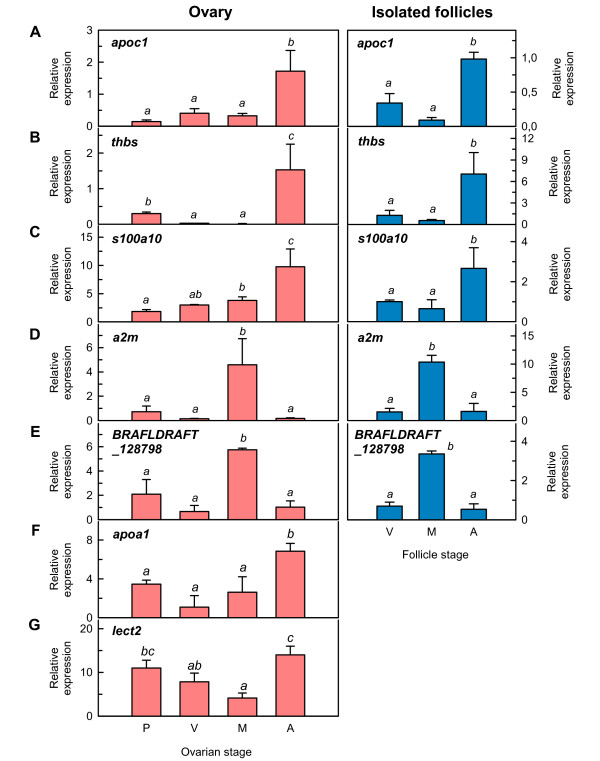
Figure 5.
Expression profile of selected transcripts during Senegalese sole ovarian development. Histograms represent relative mean expression values ± SEM (n = 3 females) in ovaries (left panels) or in isolated ovarian follicles (right panels) of apolipoprotein C-I (apoc1; A), thrombospondin (thbs; B), S100A10 calcium binding protein (s100a10; C), alpha-2-macroglobulin (a2m; D), hypothetical protein BRAFLDRAFT_128798 (BRAFLDRAFT_128798; E), apolipoprotein A-I (apoa1; F), and leukocyte cell-derived chemotaxin 2 (lect2; G). Data were determined by qPCR and normalized to 18S ribosomal protein (18S) expression. Data with different superscript are statistically significant (p < 0.05).

