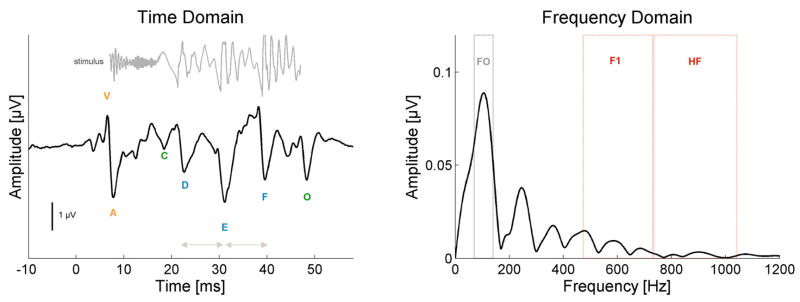
Figure 2.
Schematic of the brainstem response to the speech syllable [da] in the time (left) and frequency (right) domains. The time domain waveform of the stimulus is plotted in gray above sABR waveform. The stimulus is time-shifted 8 ms in order to facilitate its visual comparison with the response by accounting for the neural conduction lag. Onset measures (V, A latencies) are labeled in orange. Spectrotemporal (D, E, F latencies) elements are labeled in blue. Envelope Boundary measures (C, O latencies) are labeled in green. Pitch measures (F0 amplitude, E–D, F–E inter-peak latencies) are labeled in grey and Harmonic measures (F1, HF amplitudes) are labeled in red.

