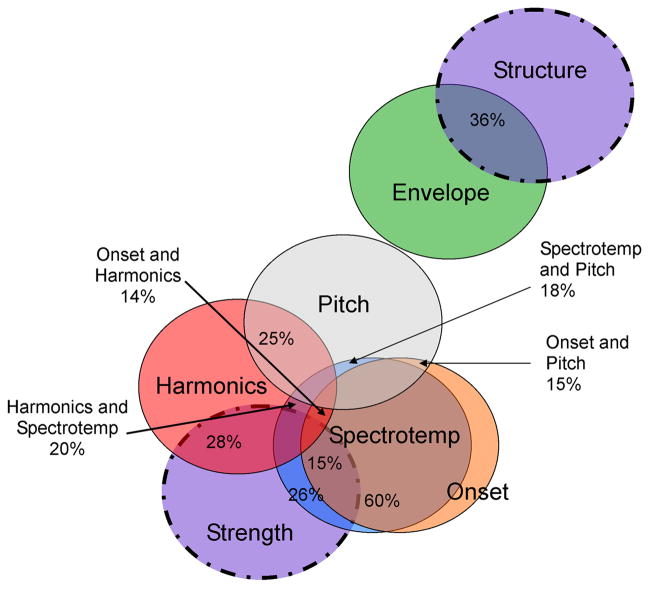
Figure 3.
Venn diagram of the relationships between composite sABR and DPOAE measures. sABR circles are solid; DPOAE circles are dashed. The percentage overlap between the variables (R2; bivariate relationships) is marked. While all measures are in some minor way related, and all circles in the figure should be touching, any overlap not reported was less than 0.5%. Spectrotemporal was shortened to Spectrotemp for space constraint reasons. Note that only a weak relationship was observed between the two DPOAE composite measures, Strength and Structure (R2 = 0.0025).

