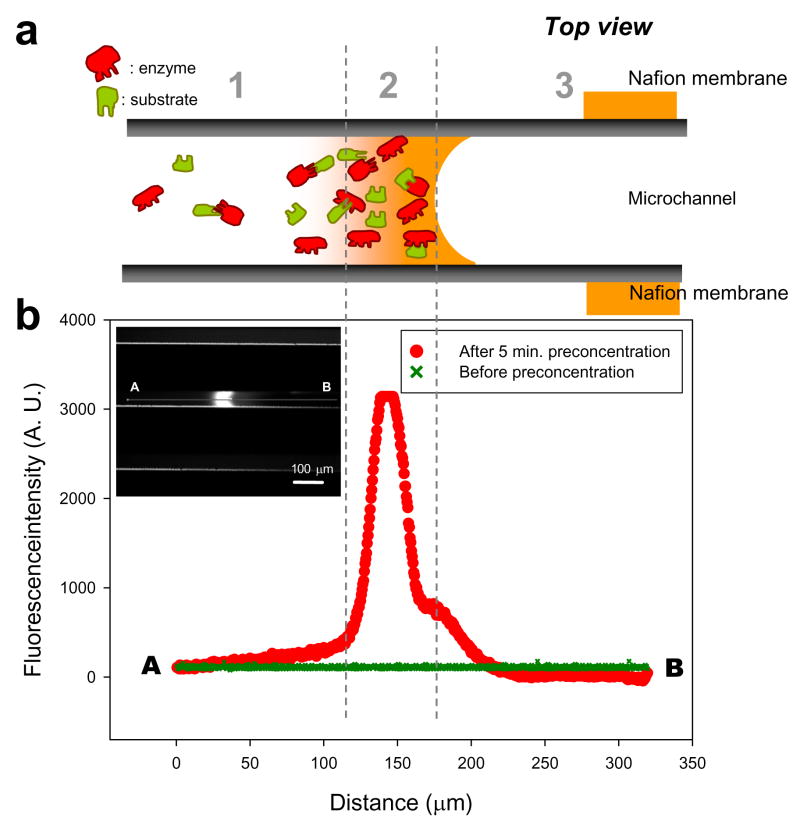
Figure 2.
(a) Schematic of electrokinetic trapping of enzyme and substrate and (b) intensity profile along the microchannel as a measure of the enzyme-substrate reaction product after 5 minutes of preconcentration. It shows an increased concentration of the enzyme-substrate reaction product in the concentrated reaction zone generated by electrokinetic trapping (zone 2). Zone 1 contains the mixture of trypsin and BODIPY FL casein outside of the concentrated reaction zone. The difference of the fluorescence signals between zone 1 and 2 indicates an enhanced enzyme-substrate reaction through the preconcentration. The increase of the intensity was partly due to the stacking of the reaction products flowing from zone 1. The Zone 3 illustrates the depletion zone, allowing a control experiment to estimate the background noise that can be generated from the adsorption of the reaction products on the side wall of the microchannel.

