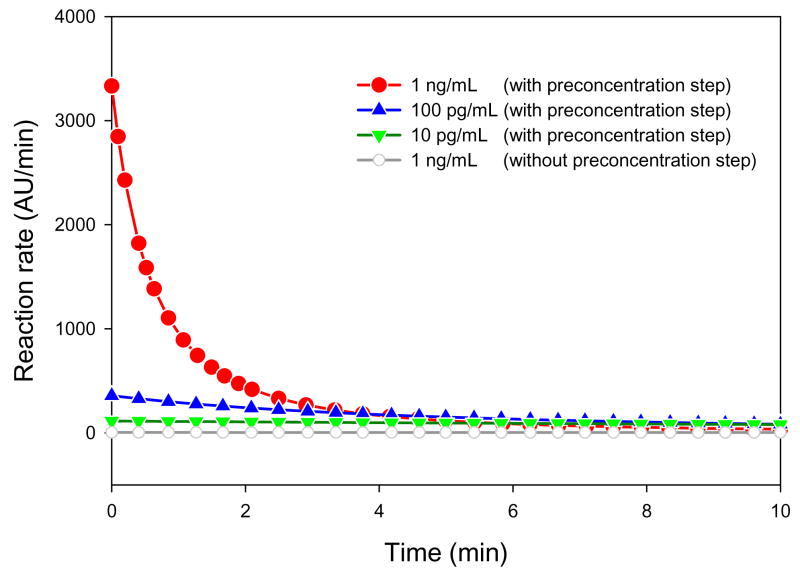
Figure 5.
Reaction rate versus preconcentration time, calculated from the fitting curve (Figure 4). In case of ctrypsin = 1 ng/mL, the initial slope was drastically increased through preconcentration (compare with the grey line (open circle) which shows the slope curve of the same concentration without preconcentration). At ctrypsin = 100 pg/mL, the initial slope was still higher than any of those measured without preconcentration. In case of the lowest concentration tested, ctrypsin = 10 pg/mL, the initial reaction rate was comparable to the initial slope of ctrypsin = 10 ng/mL without preconcentration.

