
Figure 7. Regional alignment error for all eyes included in the study.
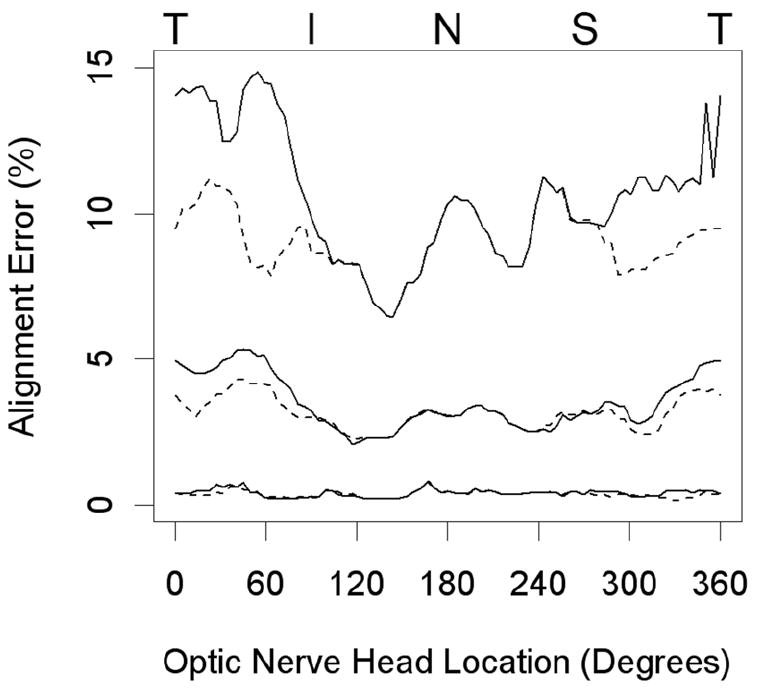
The lines shown are for the median (middle lines), 95 % (upper lines) and 5 % quantiles of alignment error. This is measured at each 4.5° location as a moving average of that location and the 2 locations either side of it. Solid lines indicate the degree of misalignment from the disc margin of the curves generated by the neural canal opening, whereas the dotted lines indicate the degree of misalignment from the disc margin of the curves generated by a combination of the neural canal opening and the Border Tissue. (T = temporal, I = inferior, N = nasal, S = superior)