Table 3.
One-Pot Preparation of Potassium Azidoaryltrifluoroboratesa
 | ||||||
|---|---|---|---|---|---|---|
| entry | X–Ar–BF3K | reaction time (h) | product | yield | ||
| 1 |  |
1a-Br 1a-I |
7 1 |
 |
1b | 95% 95%b |
| 2 |  |
2a-Br 2a-I |
9 6 |
 |
2b | 90% 93% |
| 3 | 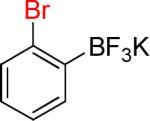 |
3a | 24 | 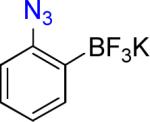 |
3b | 73% |
| 4 | 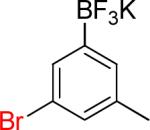 |
4a | 8 | 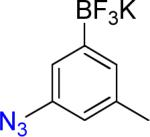 |
4b | 93% |
| 5 |  |
5a | 12 |  |
5b | 90% |
| 6 | 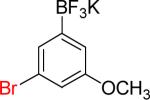 |
6a | 4 | 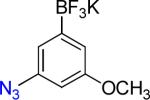 |
6b | 92%c |
| 7 | 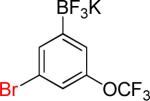 |
7a | 12 |  |
7b | 83%c |
| 8 | 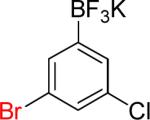 |
8a | 12 | 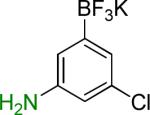 |
8b | 91%c |
| 9 |  |
9a | 1 |  |
9b | 98% |
| 10 |  |
10a | 1 |  |
10b | 98% |
| 11 |  |
11a | 3 |  |
11b | 95% |
| 12 |  |
12a | 3 |  |
12b | 95% |
| 13 | 13a | 12 | 13b | 90% | ||
| 14 | 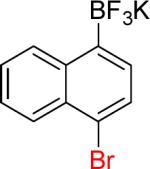 |
14a | 10 | 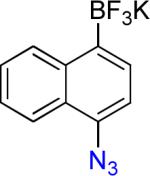 |
14b | (82%)c,d |
| 15 | 15a | 13 | 15b | (82%)e | ||
| 16 |  |
16a | 5 min |  |
16b | 96% |
All reactions were performed on a 1.0 mmol scale in 4 mL of DMSO and monitored by 1H NMR in D2O. Yields are given for isolated products.
Reaction was performed on a 3.0 mmol scale.
Products were obtained as amorphous solids.
Product was contaminated with about 10% of 14a.
Product was contaminated with about 15% of the azide product.
