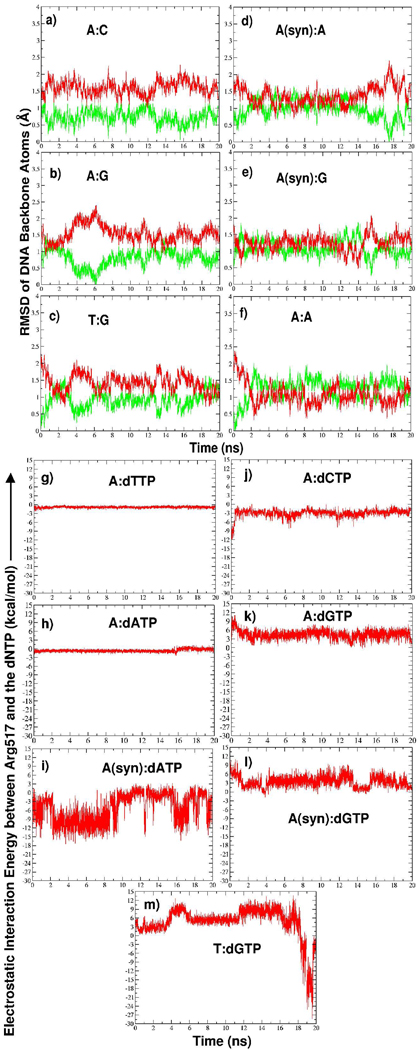
Figure 2.
(a)–(f) Time evolution of the RMSD of DNA backbone atoms (P, O3′, C3′, C4′, C5′, O5′, O5T) in all trajectories relative to the active (green, PDB entry 1XSN) and inactive (red, PDB entry 1XSL) DNA positions. Superposition is performed with respect to protein Cα atoms. RMSD plots do not start at zero because each system was equilibrated prior to production dynamics. (g)– (m) Time evolution of Arg517/dNTP electrostatic interaction energy in correct and mismatched system trajectories.

