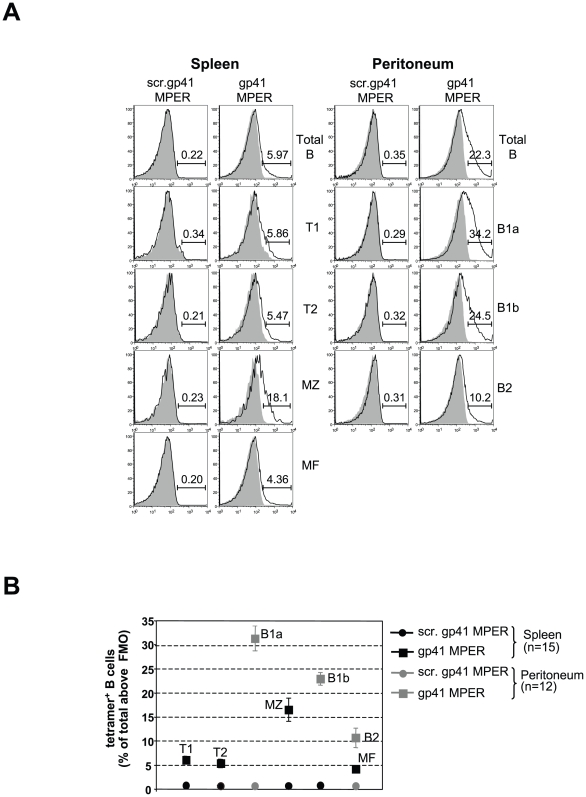
Figure 2. Relative frequencies of gp41 MPER-reactive cells in B cell subsets.
A) Representative surface staining with gp41 MPER tetramers (100 ng/106 cells) in splenic and peritoneal B cell subsets from naïve BALB/c mice. For each subset, shown are open histograms indicating either the APC-labeled scrambled gp41 MPER tetramer (left panels), or the gp41 MPER tetramer (right panels), relative to background staining without tetramer (filled histograms). B cell populations in all tissues were gated as singlet, live, lineage−, CD19+B220+ cells, and subsets within B cell fractions were identified using published subfractionation schemes [44], [74]–[76]. Numbers indicate the percentage of tetramer-reactive B cells from a representative experiment (mean±s.d of five mice). B) Graphical representation of relative gp41 MPER reactivities in spleen (black) and peritoneal cavity (gray) B cell subsets, as calculated from several flow cytometry experiments (≥3 mice/experiment) as described in A). Numbers indicate the total mice analyzed.

