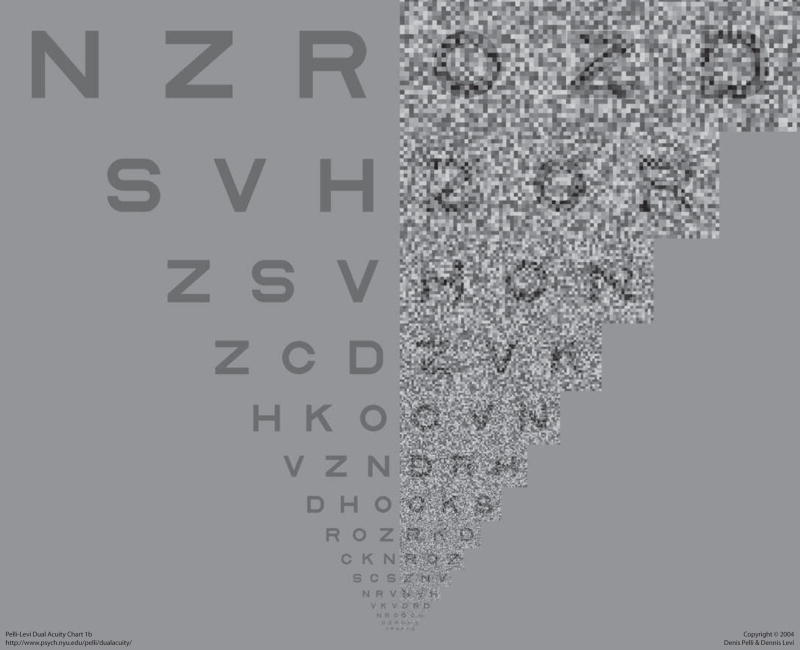
Figure 1.
Pelli-Levi Dual Acuity Chart. Ask the observer to read all six letters on each line, continuing down the chart until the observer gets all three no-noise letters wrong. Give credit (1/3 line) for each letter right in the last triplet in which any letters were correctly read. The chart is scale-invariant and may be used at any distance. The score of interest is the difference in log acuities (i.e., lines) between the two sides. So far, we have found no difference in six normals and a 1 or 2 line difference in the five amblyopes tested. The chart is available at http://psych.nyu.edu/pelli/dualacuity/. Copyright © 2004 Denis Pelli & Dennis Levi.

