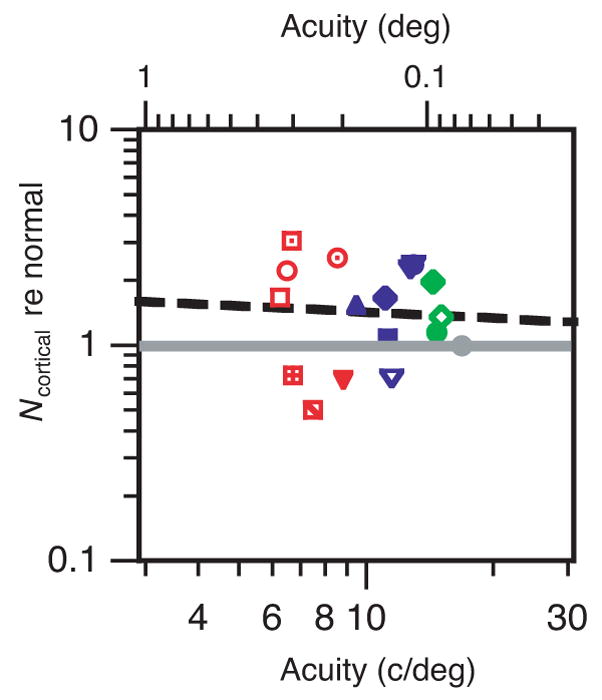
Figure 6.

Cortical noise relative to normal versus acuity. Same symbols as in Figure 5. The solid gray line is normal; the dashed black line is a regression line with slope −0.096 and R2=0.004. The geometric mean of Ncortical re normal is 1.33 for the severe (red), 1.48 for the moderate (blue), and 1.45 for the mild (green) amblyopes. The geometric mean is 1.41 across all the amblyopes.
