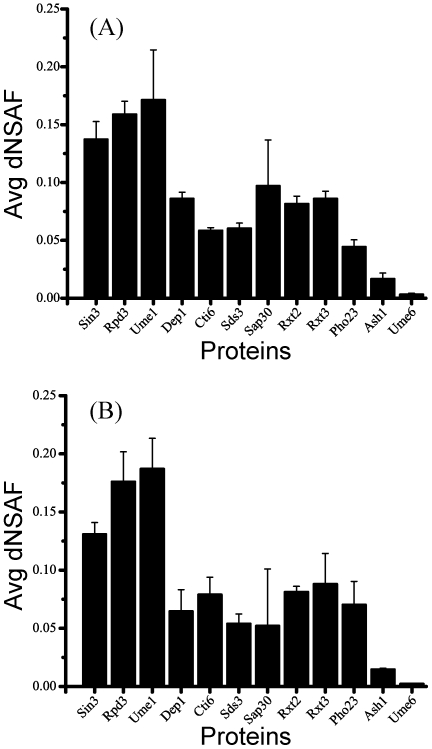
Figure 2. Relative abundances of Rpd3/Sin3 components.
For visualization purposes, the components of the Rpd3/Sin3 complexes were represented using (A) Pho23-TAP, and (B) Sap30-TAP, MudPIT analysis was performed on three replicates for each of the purification and the observed dNSAF values for each subunit averaged. Error bars are shown and represent one standard deviation of the data.

