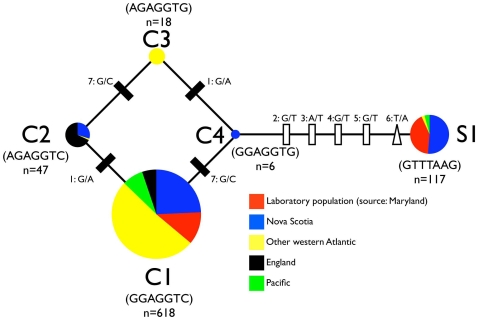
Figure 4. Haplotype tree depicting the relative abundances and mutational distances between the five nfkb variants.
The evolution of the 5 Nematostella nfkb variants can be explained by two mutation events at SNP1, two events at SNP7, and five separate events at SNPs 2–6. Circles indicate individual alleles. The overall abundance of each allele is proportional to circle area. Colored wedges depict the fraction of each allele that comes from a given geographic region. Silent mutations are indicated by rectangles. The missense mutation underlying the Cys/Ser polymorphism in the DNA recognition loop is indicated by a triangle.

