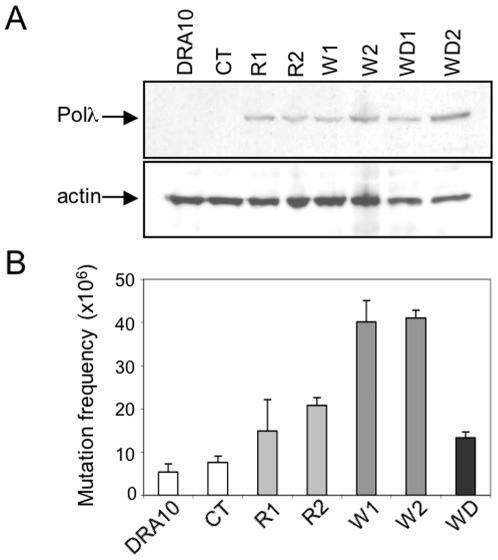
Figure 3. The W438 variant of hPolλ increases mutagenesis in vivo.
(A) Immunoblotting of hPolλ in the cell lines overexpressing hPolλ R438 (R1 and R2) and W438 (W1, W2 and the catalytic inactive WD) as compared to control CHO-Dra10 and CT cells (cells transfected with the empty expression vector). As the endogenous levels of hamster Polλ were not detectable, normalization was carried out with actin antibodies. (B) Mutation frequency of hPolλ-overexpressing clones. To determine spontaneous mutagenesis, cells were plated at a density of 106 cells and exposed to 20 µM 6TG-containing media in order to count the number of HPRT mutants. After 1 additional week, macroscopic colonies were scored and mutation frequencies were calculated by correcting for plating efficiency. The data presented is the average of three independent experiments. The p values relative to the control CT are 0.019, 4.6 10−3, 3.1 10−3, 1.3 10−4, and 0.045, for R1, R2, W1, W2 and WD, respectively.

