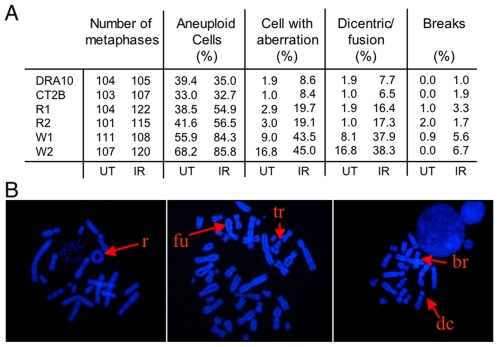
Figure 5. Karyotype analysis of W438 hPolλ-expressing cells.
(A) Increased chromosomal instability in W438 hPolλ-expressing cells. Metaphase spreads of either untreated (UT) or 2 Gy-treated (IR) cells corresponding to either control clones (DRA10 and CT2B), or to clones overexpressing either R438 (R1, R2) or the W438 variant (W1, W2) of hPolλ. (B) Examples of chromosomal aberrations observed in cells expressing the W438 variant of hPolλ.

