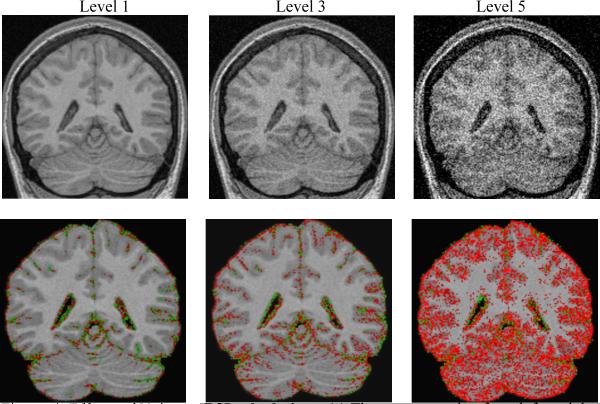
Figure 4. Effects of Noise on BSI calculations.
(a) The top row, going from left to right, are SPGR images with increasing noise. (b) Below each respective image is its BSI object map overlaid on the SPGR scan where no noise was added. As noise increases, the BSI brain and ventricle values progressively diverge from zero and suggest increased brain atrophy. In each case the BSI object map is calculated by “subtracting” the second altered scans from the base 25 degree FA bas scan. The red and green pixels represent a color map of BSI computed change in volume superimposed on the baseline grey scale MRI scan. Red indicates shrinkage and green expansion of the color annotated pixel.

