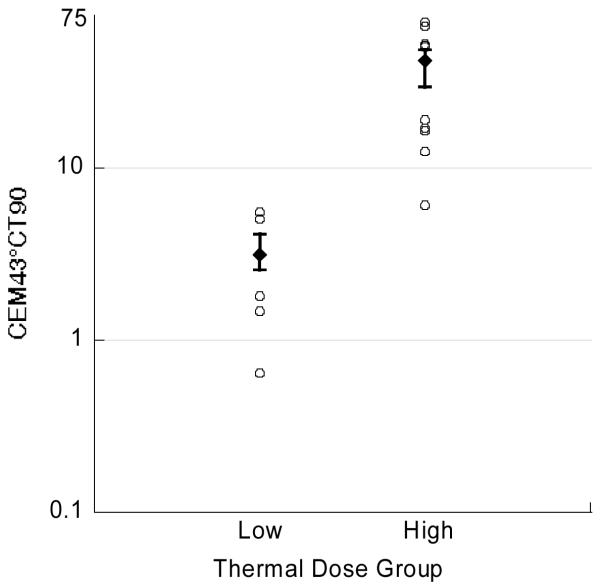
Figure 1.
Median thermal dose in each thermal dose group. Error bars represent the 25th and 75th percentile. There were 5 dogs in the low dose group (3 lower and 2 higher) and 10 dogs in the high dose group (5 lower and 5 higher) whose thermal dose fell outside the prescribed range. These dogs are represented by the open circles. Note log scale on ordinate.

