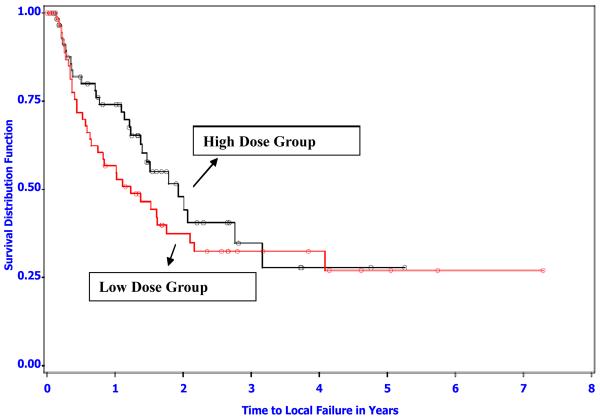
Figure 2.
Kaplan-Meier survival distribution function estimates of time to local failure for the low and high thermal dose groups (logrank p-value=0.28). There were 35 and 28 local occurrences in the low and high dose group, respectively. Open symbols represent censored observations (death due to any cause with no local recurrence (15 and 24 for low and high), living patients with no local occurrence (7 and 8 for low and high), and amputations including tumor site (1 and 4 for low and high)).

