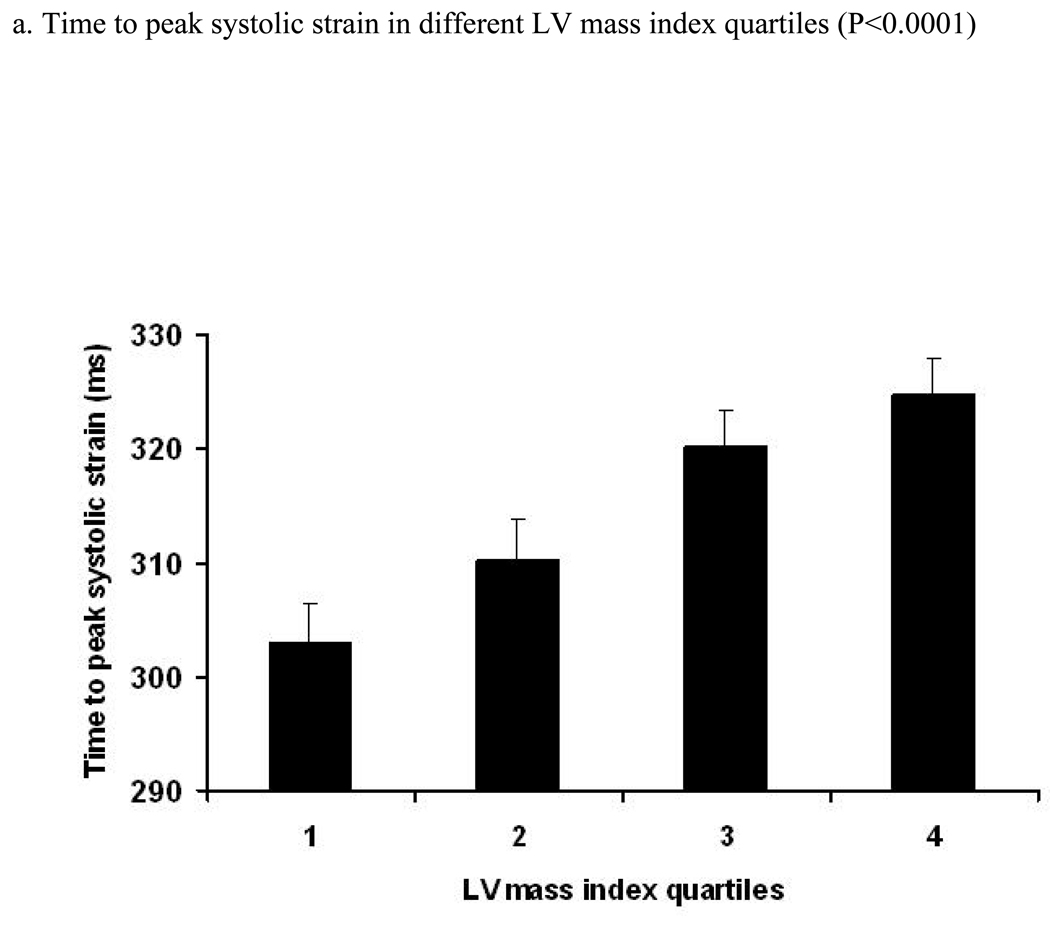
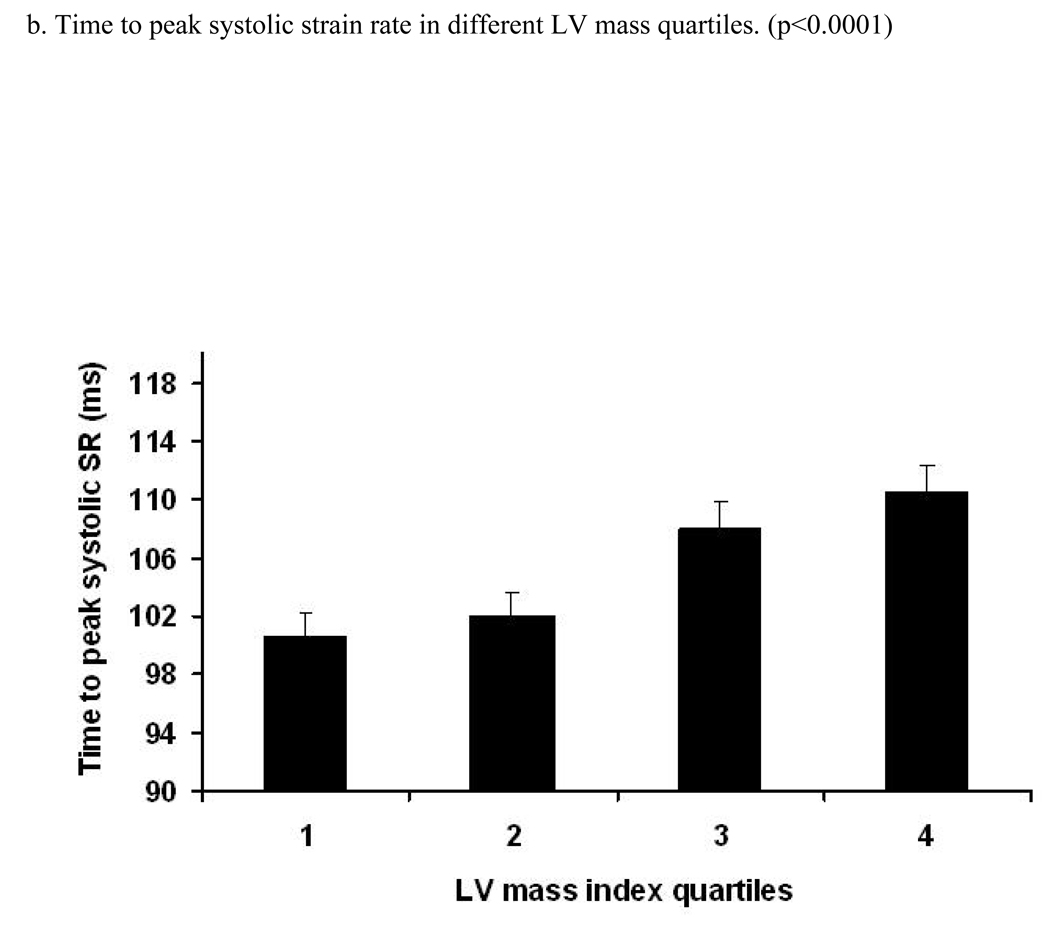
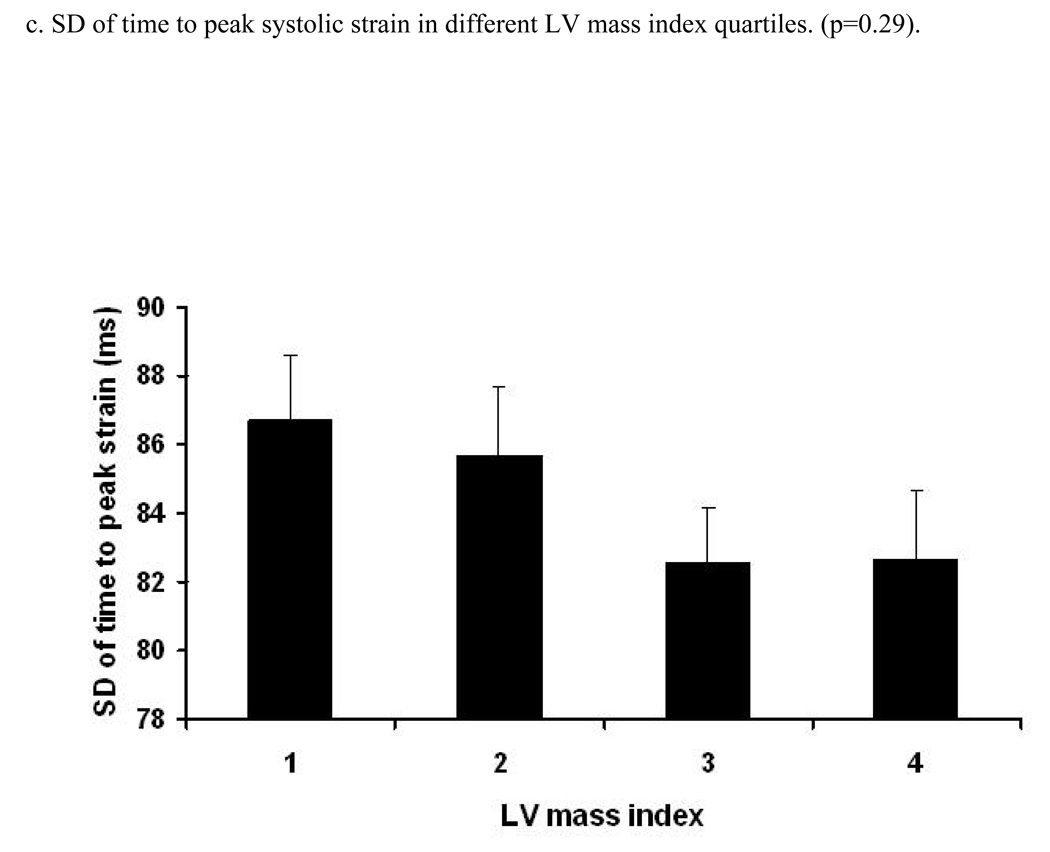
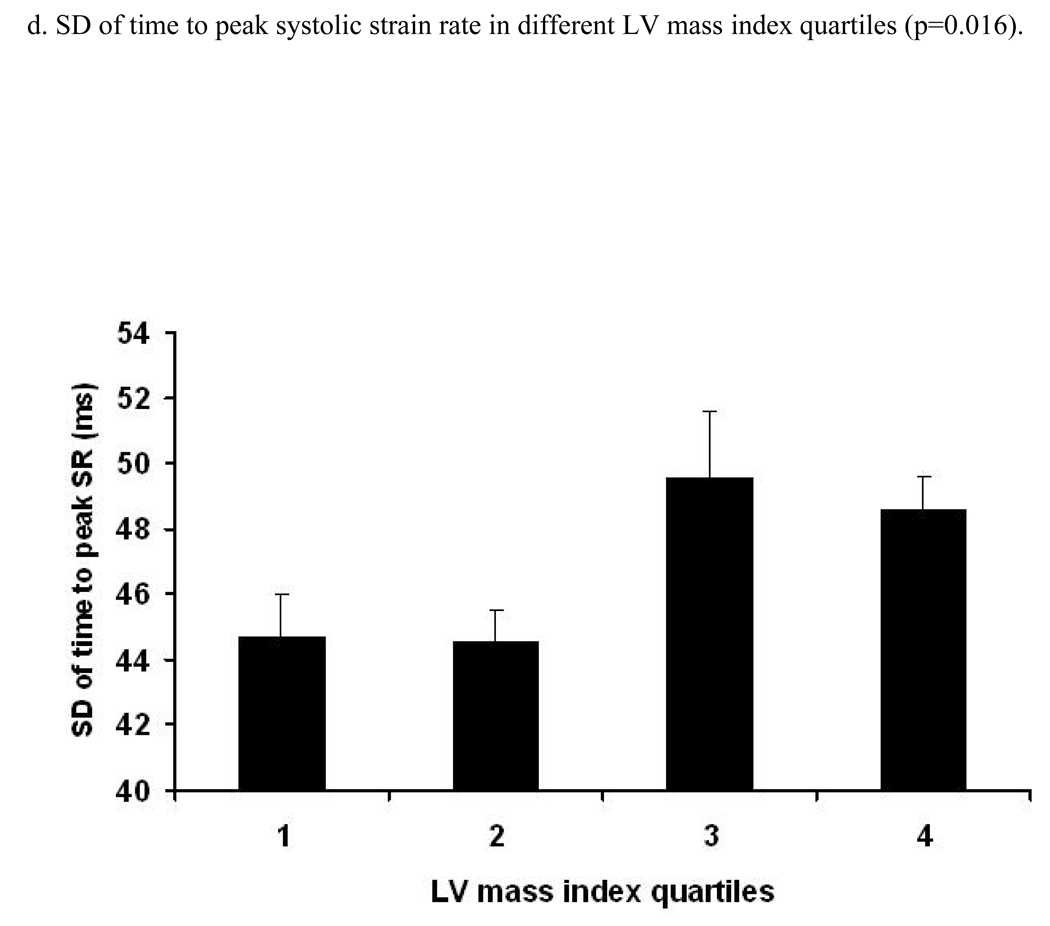
Figure 3. Relation between LV mass index (LV mass/height2.7) and time to peak systolic strain, strain rate and their standard errors (trend was tested by ANOVA, p- significance value).
Relation between quartiles of increasing LV mass index (LV mass/height2.7) and time (ms) to peak systolic strain (a), strain rate (b) and SD of strain (c) and strain rate (d). X axis shows quartiles of LV mass index, Y axis indicates time to peak systolic strain (a), strain rate (b), SD of time to peak systolic strain (c) and SD of time to peak systolic strain rate (d). S.E bars are shown.


