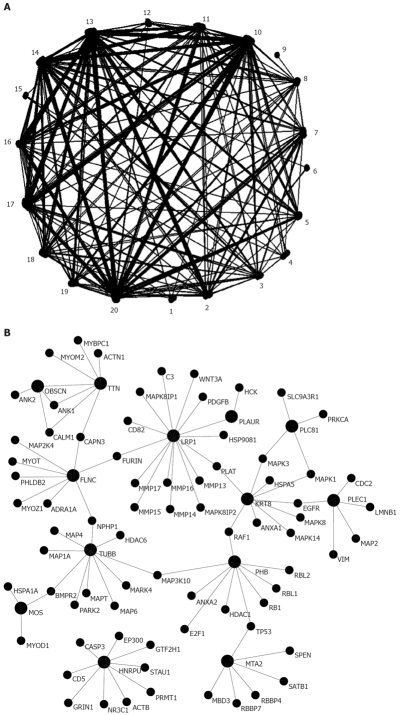
Figure 2.
Protein-protein interaction network. A: Interactions of metastasis-related proteins. Based on the data from HPRD, protein-protein interactions were plotted using Osprey. Interactors are represented as nodes and grouped according to their biologic function based on Osprey annotation; B: A subnetwork displaying important proteins, such as Mos, LRP1, MTA2, and MAPK.

