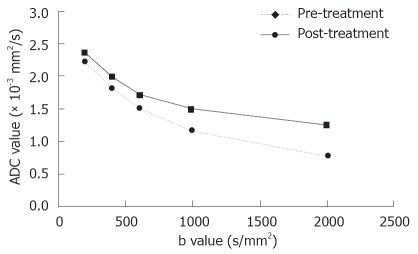
Figure 3.
Plots of averaged ADC values for all 12 tumors vs different sets of b-values of hepatic tumors pre- and post-treatment. ADC values present as a function of b factors. The early effect of therapy on diffusion is shown by a substantial increase in ADCs, especially at a large b factor (≥ 600 s/mm2).

