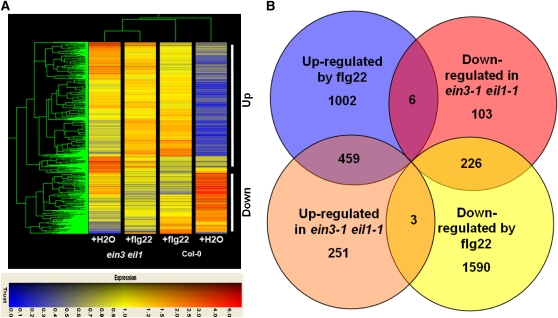
Figure 4.
Microarray Analysis of Genes Regulated by EIN3/EIL1 and flg22.
(A) Hierarchical clustering of genes differentially regulated in Col-0 and ein3-1 eil1-1 plants. Clustering was performed using uncentered Pearson correlation and complete linkage clustering and was visualized with TREEVIEW (Eisen et al., 1998). The 1048 probe sets differentially expressed in water-treated Col-0 and ein3-1 eil1-1 plants were used for the analysis. Genes upregulated and downregulated in water-treated ein3-1 eil1-1 plants are indicated. Colors indicate normalized hybridization signal on a scale of 0 to 5.
(B) Venn diagram of genes commonly regulated by EIN3/EIL1 and flg22.

