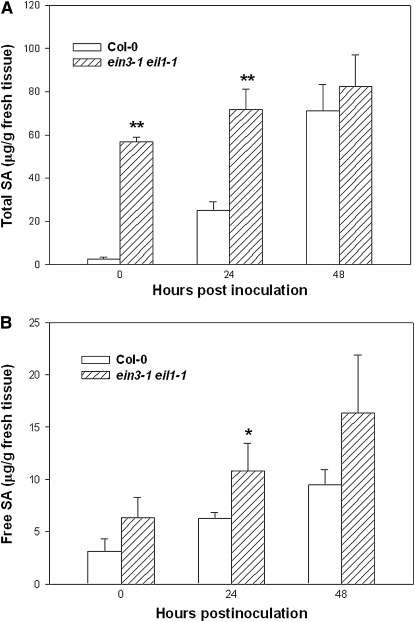
Figure 6.
Heightened SA Level in ein3-1 eil1-1 Double Mutant Plants.
(A) Total SA in the ein3-1 eil1-1 and Col-0 plants.
(B) Free SA in the ein3-1 eil1-1 and Col-0 plants.
Plants were inoculated with DC3000 bacteria (106 cfu/mL) for the indicated hours, and tissues were collected for SA extraction. Each data point consisted of three replicates. Error bars indicate sd. * and ** indicate significant difference at 0.05 and 0.01, respectively (Student's t test). The experiment was repeated twice with similar results.

