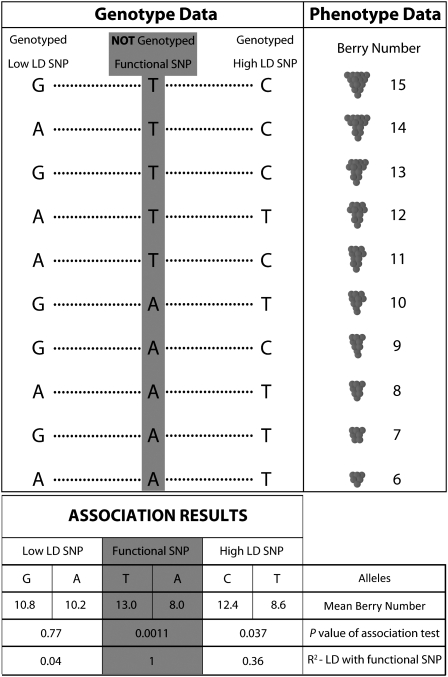
Figure 1.
A Fictional Depiction of a Simple Genotype-Phenotype Association Test.
The functional SNP responsible for variation in berry number in grapevine is in gray and is not genotyped. The genotyped SNPs lie on either side of the functional SNP. The genotyped SNP to the right is in high LD with the functional SNP, while the genotyped SNP to the left is not in LD with the functional SNP. The results of a simple association test (Pearson correlation) are shown in the bottom box. The C allele of the high LD SNP is significantly associated with berry number (P = 0.037), while there is no significant association for the low LD SNP (P = 0.77).

