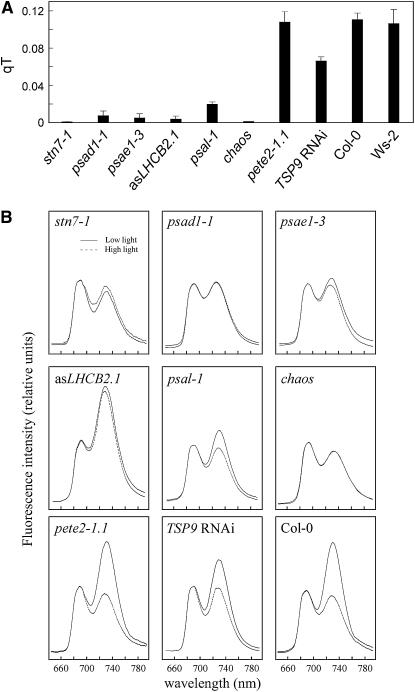
Figure 1.
Short-Term Photosynthetic Acclimation in Photosynthetic Mutants.
(A) Quenching of chlorophyll fluorescence due to state transitions (qT). Bars indicate sd using five plants of each genotype.
(B) The 77 K fluorescence emission spectra of the wild type (Col-0) and mutants. Spectra (traces are the average of 10 replicates) were recorded after illumination of plants with low light (80 μmol m−2 s−1, solid lines) and high light (800 μmol m−2 s−1, dotted lines) for 3 h by excitation at 475 nm. The 77 K fluorescence spectra were normalized at 685 nm. Note that, in both psad1-1 and psae1-3, a 3-nm blue shift in the far-red florescence emission peak was observed. The possibility that the light intensities chosen to induce state transitions could elicit photoinhibition was monitored by measurements of Fv/Fm values before and after the light treatment. The identical Fv/Fm values indicated the absence of any photoinibition. Note that wild-type plants of ecotype Ws-2 behaved identically to Col-0.

