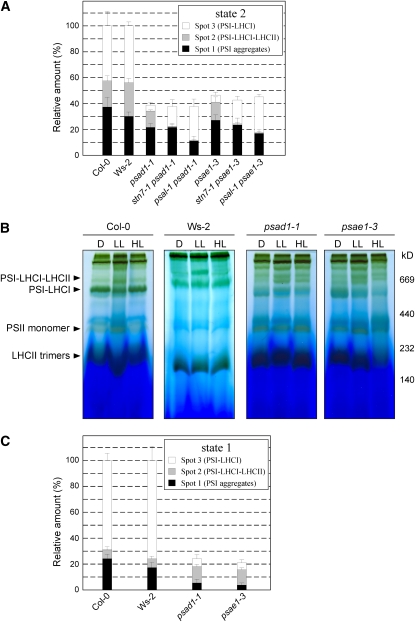
Figure 4.
Quantification of PSI-LHCI and PSI-LHCI-LHCII Complexes Associated with Low (State 2) and High Light–Adapted (State 1) Thylakoid Membranes from Wild-Type (Col-0 and Ws-2) and Mutant Plants.
(A) 2D-PAGEs, as in Figure 2, of thylakoid membranes isolated from wild-type (Col-0 and Ws-2) and mutant leaves adapted to low light (state 2 condition, 80 μmol m−2 s−1 for 3 h), were stained with Coomassie blue (see Supplemental Figure 2A online). The densitometric quantification of the spots representing PSI aggregates (spot 1), PSI-LHCI-LHCII (spot 2), and PSI-LHCI (spot 3), shown in Supplemental Figure 2A online, is shown. Values are averages of three independent 2D gels for each genotype. Pools of 20 plants each genotype were used to isolate thylakoids. Bars indicate sd.
(B) BN-PAGE of identical amounts of thylakoid proteins isolated from wild-type (Col-0 and Ws-2), psad1-1, and psae1-3 leaves adapted to darkness for 16 h (D) (state 1 condition), low light (LL; 80 μmol m−2 s−1 for 3 h) (state 2 condition), or high light (HL; 800 μmol m−2 s−1 for 3 h) (state 1 condition).
(C) The BN gel high-light (state 1 conditions, 800 μmol m−2 s−1 for 3 h) lanes from the wild type (Col-0 and Ws-2), psad1-1, and psae1-3 in Figure 4B were subjected to denaturing PAGE, and the 2D gels were stained with Coomassie blue (see Supplemental Figure 2B online). Spots representing PSI aggregates, PSI-LHCI-LHCII and PSI-LHCI, under high light conditions (state 1), displayed in Supplemental Figure 2A online, were densitometrically quantified as in (A).

