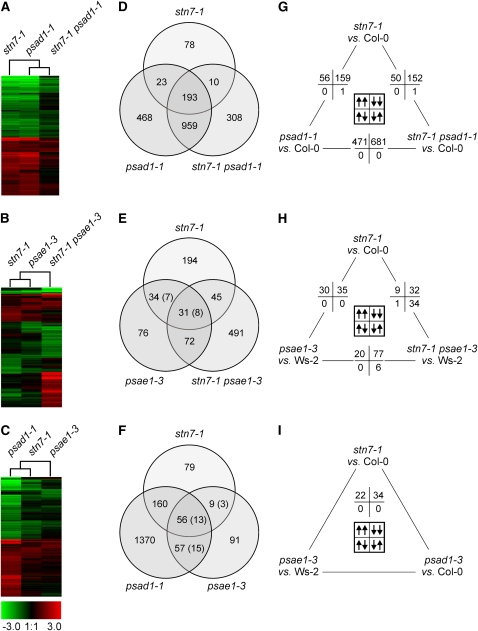
Figure 8.
Transcript Profiles of LTR Mutants and Identification of Coregulated Gene Sets.
(A), (D), and (G) stn7-1, psad1-1, and stn7-1 psad1-1 mutants.
(B), (E), and (H) stn7-1, psae1-3, and stn7-1 psae1-3.
(C), (F), and (I) stn7-1, psad1-1, and psae1-3.
(A) to (C) Hierarchical clustering of mRNA expression profiles. The cladogram at the top summarizes the relatedness of transcriptome responses. Colors indicate up- (red) or downregulation (green) of genes, with respect to wild-type (Col-0 or Ws-2) controls.
(D) to (F) Venn diagrams depicting the overlap of genes whose expressions were found in Affymetrix GeneChips analyses to be differentially regulated. The number of genes that are differentially regulated in two different wild-type ecotypes employed in this study (Col-0 and Ws-2) is indicated in parentheses.
(G) to (I) Pairwise comparison of nuclear transcript profiles. Numbers of significantly differentially regulated genes in the same (up/up or down/down) or opposite (up/down or down/up) direction are provided. Note that array data have been validated by monitoring the expression of a subset of genes in the different genotypes using real-time PCR analysis (see Supplemental Table 8 online).

