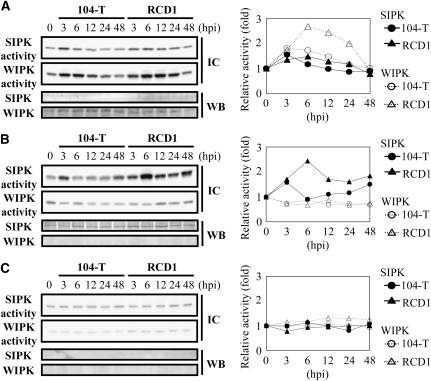
Figure 7.
Kinase Activity of SIPK and WIPK during Infection of Silenced Plants.
A conidial suspension (1 × 10⁶ conidia/mL) of the wild-type 104-T or ssd1 mutant RCD1 was sprayed onto leaves of SIPK-silenced (A), WIPK-silenced (B), and SIPK- and WIPK-silenced (C) plants. At time points of 0 h (no inoculation) and 3, 6, 12, 24, and 48 HAI, proteins were extracted from the leaves of inoculated plants and subjected to an immunocomplex kinase assay (IC; top panels). Gene silencing was evaluated by immunoblot analysis (WB; bottom panels). The graph to the right of each panel indicates the relative kinase activity calculated by comparison with activity at 0 h. Kinase activity was determined in silenced plants in two biological replicates. One set of representative data is shown in this figure.

