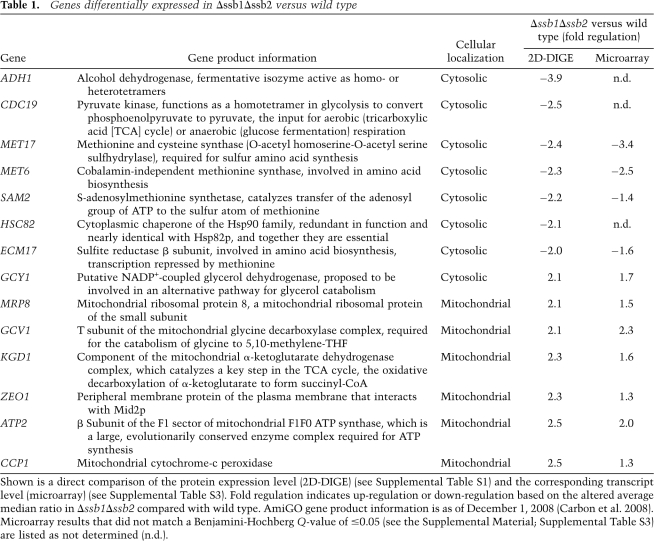
Table 1.
Genes differentially expressed in Δssb1Δssb2 versus wild type
Shown is a direct comparison of the protein expression level (2D-DIGE) (see Supplemental Table S1) and the corresponding transcript level (microarray) (see Supplemental Table S3). Fold regulation indicates up-regulation or down-regulation based on the altered average median ratio in Δssb1Δssb2 compared with wild type. AmiGO gene product information is as of December 1, 2008 (Carbon et al. 2008). Microarray results that did not match a Benjamini-Hochberg Q-value of ≤0.05 (see the Supplemental Material; Supplemental Table S3) are listed as not determined (n.d.).

