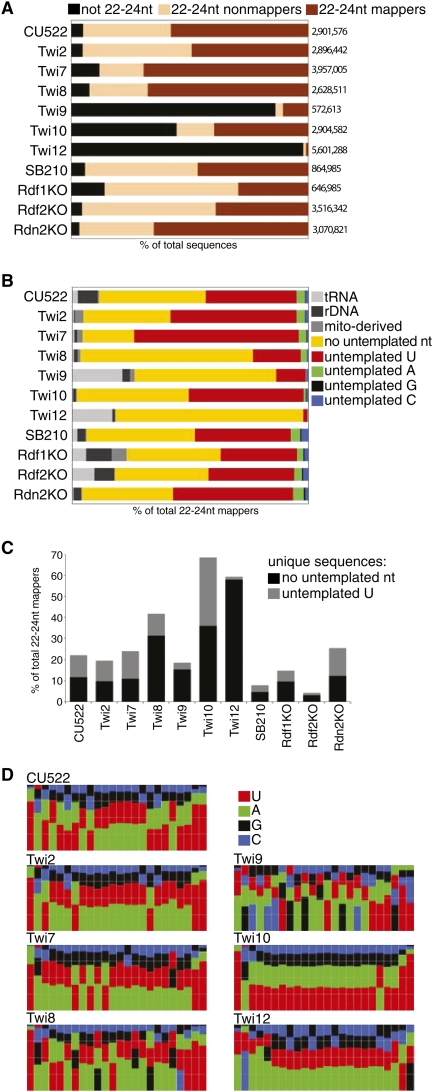
Figure 2.
Deep sequencing library characteristics. (A) Proportions of sequence types in each unfiltered library. The number of total sequences from each library is indicated at right. (B) Proportions of 22- to 24-nt sequences in each library that mapped to the genome allowing a single 3′-nucleotide mismatch. Sequences indicated as rDNA were derived from the chromosome encoding the large ribosomal RNA precursor. Sequences indicated as mito-derived were from the mitochondrial genome. Further analysis was carried out on sequences represented by the yellow and red bars. (C) Fraction of distinct sequences (the inventory of unique sequences) calculated separately for genome-matching or definitively 3′-U-extended sRNAs. (D) Nucleotide frequency plots for genome-matching 22- to 24-nt sRNA sequences from each library. Nucleotide frequency plots for sRNAs with a definitively untemplated 3′ U are shown in Supplemental Figure S4.

