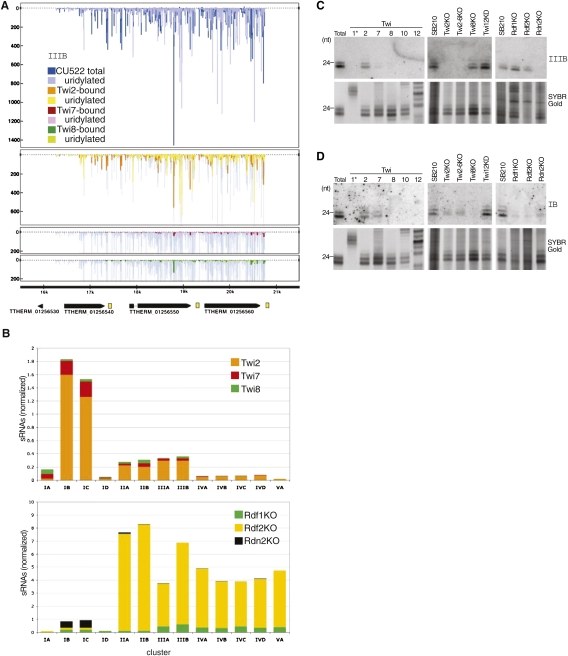
Figure 3.
Pseudogene-derived sRNA clusters. (A) sRNA density plots for a representative pseudogene locus (IIIB). Density of sRNAs from each Twi-enriched library is shown superimposed on density from the total sRNA library of CU522. Peak height indicates the number of sRNA reads with the same 5′-end position at that genome location. Peaks above the zero axis represent sequences on the top strand and peaks below the zero axis represent sequences on the bottom strand. Annotations for predicted protein-coding genes (TTHERM numbers shown) are indicated at the bottom of the panel; yellow boxes indicate A-rich tracts. (B) Comparisons of sRNA numbers mapping to 13 genome locations of pseudogene loci. Number of sRNAs enriched by each Twi protein (top panel) or present in total sRNA from RDRC subunit knockout strains (bottom panel) was normalized to the corresponding wild-type library by the number of filtered sequences. Loci are indicated by the name of the ORF family (I, II, III, IV, or V) and cluster within that family (A, B, C, D). Note the difference in scale between the top and bottom panels of the figure. (C,D) Northern blot hybridization with an oligonucleotide probe complementary to a sRNA from pseudogene cluster IIIB or IB, as indicated. Below the blots, RNA loading is shown by SYBR Gold staining.

