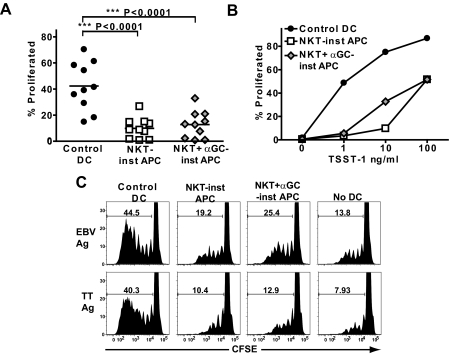
Figure 4.
Stimulation of T cell proliferation. (A) Allogeneic peripheral blood T cells were labeled with CFSE and cultured with the indicated APCs for 7 days. Each symbol shows the percentage of the live T cell population that underwent cell division (as assessed by reduction of CFSE fluorescence) from one allogeneic T cell + DC pairing. (B) Autologous peripheral blood T cells were stimulated by APCs that were treated with the indicated concentrations of TSST-1 superantigen. The results shown are from one representative experiment out of 3 independent analyses. (C) APCs were pulsed with purified Epstein-Barr virus protein (EBV Ag) or with Tetanus Toxoid (TT Ag) and used to stimulate autologous peripheral blood T cells. The plots show the CFSE fluorescence of DAPI−/CD3+ cells, with gate markers indicating the percentage of cells that show evidence of having proliferated. Similar results were obtained in 3 independent experiments.

