
Table 4.
Observed and predicted values for TFK-mediated carboxylesterase inhibition using classical QSAR and CoMFA analyses
| No. | TFK structureb | pKia |
log Pc | L | B5 | |||||||||||||||||
|---|---|---|---|---|---|---|---|---|---|---|---|---|---|---|---|---|---|---|---|---|---|---|
| hiCE |
hCE1 |
rCE |
||||||||||||||||||||
| Obsd 5 min | Obsd 24 h | Eq. (7a) | Eq. (7b) | Eq. (10a) | Eq. (10b) | Obsd 5 min | Obsd 24 h | Eq. (8a) | Eq. (8b) | Eq. (11a) | Eq. (11b) | Obsd 5 min | Obsd 24 h | Eq. (9a) | Eq. (9b) | Eq. (12a) | Eq. (12b) | |||||
| 33 | 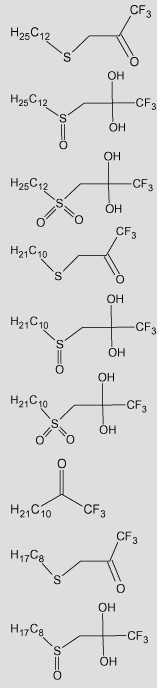 |
7.82 | 8.27 | 8.24 | 8.24 | 7.71 | 7.75 | 7.15 | 8.13 | 7.23 | 7.26 | 7.11 | 7.03 | 6.80 | 8.48 | 6.73 | 6.76 | 6.84 | 6.81 | 6.63 (6.07) | 14.38 | 10.27 |
| 34 | 7.27 | 9.40 | 7.07 | 7.14 | 6.77 | 6.86 | 5.72 | 9.40 | 5.87 | 5.89 | 5.65 | 5.64 | 5.96 | 8.85 | 6.24 | 6.23 | 5.73 | 5.84 | 5.12 (4.43) | 14.38 | 10.27 | |
| 35 | 7.49 | 9.00 | 7.01 | 7.08 | 7.65 | 7.70 | 6.13 | 9.40 | 5.80 | 5.81 | 6.33 | 6.30 | 6.82 | 9.15 | 6.20 | 6.19 | 6.95 | 6.88 | 5.04 (4.34) | 14.38 | 10.27 | |
| 36 | 6.82 | 8.34 | 7.49 | 7.47 | 7.08 | 7.13 | 6.89 | 8.40 | 7.07 | 7.11 | 7.02 | 6.89 | 6.80 | 8.55 | 6.96 | 7.00 | 6.88 | 6.80 | 5.57 (5.02) | 12.33 | 8.33 | |
| 37 | 5.72 | 9.30 | 6.32 | 6.37 | 6.00 | 5.90 | 5.28 | 9.30 | 5.71 | 5.74 | 5.53 | 5.46 | 5.60 | 8.52 | 6.13 | 6.15 | 5.57 | 5.66 | 4.06 (3.37) | 12.33 | 8.33 | |
| 38 | 7.10 | 8.96 | 6.25 | 6.32 | 6.82 | 6.82 | 6.10 | 9.52 | 5.64 | 5.67 | 6.05 | 6.04 | 6.66 | 8.80 | 6.07 | 6.09 | 6.55 | 6.41 | 3.98 (3.28) | 12.33 | 8.33 | |
| 39 | 7.66 | 5.69 | 7.31 | 7.14 | 7.94 | 7.59 | 6.82 | 8.64 | 7.20 | 7.09 | 6.63 | 6.93 | 6.85 | 5.49 | 7.10 | 7.06 | 6.85 | 6.97 | 5.11 (4.76) | 10.27 | 7.39 | |
| 40 | 6.66 | 8.46 | 6.74 | 6.70 | 6.64 | 6.67 | 6.72 | 8.38 | 6.55 | 6.54 | 6.87 | 6.75 | 6.82 | 8.11 | 6.72 | 6.72 | 6.85 | 6.75 | 4.51 (3.96) | 10.27 | 7.39 | |
| 41 | 5.62 | 9.30 | 5.57 | 5.60 | 5.47 | 5.49 | 4.83 | 9.22 | 5.18 | 5.17 | 4.45 | 4.66 | 5.31 | 8.19 | 5.56 | 5.56 | 5.25 | 5.26 | 3.00 (2.31) | 10.27 | 7.39 | |
| 42 | 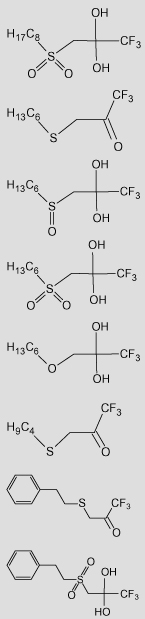 |
5.33 | 8.24 | 5.51 | 5.55 | 5.64 | 5.62 | 5.82 | 9.22 | 5.12 | 5.10 | 5.62 | 5.65 | 5.32 | 7.43 | 5.49 | 5.48 | 5.67 | 5.62 | 2.92 (2.23) | 10.27 | 7.39 |
| 43 | 6.25 | 8.19 | 5.99 | 5.94 | 6.03 | 6.30 | 6.48 | 8.28 | 6.20 | 6.19 | 6.39 | 6.58 | 6.60 | 8.00 | 6.39 | 6.37 | 6.45 | 6.62 | 3.46 (2.90) | 8.22 | 5.96 | |
| 44 | 4.17 | 9.30 | 4.82 | 4.84 | 4.51 | 4.43 | 4.10 | 8.48 | 4.85 | 4.82 | 4.18 | 4.24 | 4.64 | 7.66 | 4.90 | 4.89 | 4.71 | 4.75 | 1.95 (1.26) | 8.22 | 5.96 | |
| 45 | 4.56 | 8.43 | 4.75 | 4.78 | 4.68 | 4.56 | 5.01 | 9.15 | 4.77 | 4.74 | 5.16 | 5.09 | 4.82 | 7.46 | 4.80 | 4.80 | 4.98 | 4.95 | 1.87 (1.17) | 8.22 | 5.96 | |
| 46 | 5.04 | 8.92 | 5.45 | 5.43 | 5.38 | 4.99 | 5.48 | 9.00 | 5.57 | 5.55 | 5.87 | 5.37 | 5.57 | 8.77 | 5.76 | 5.74 | 5.79 | 5.51 | 2.76 (2.14) | 8.22 | 5.96 | |
| 47 | 5.77 | 7.78 | 5.23 | 5.17 | 5.44 | 5.64 | 6.10 | 8.27 | 5.85 | 5.82 | 6.02 | 6.16 | 6.38 | 8.11 | 5.84 | 5.79 | 6.07 | 6.21 | 2.40 (1.84) | 6.17 | 4.54 | |
| 48 | 6.12 | 8.32 | 5.59 | 5.54 | 5.89 | 6.19 | 6.92 | 8.19 | 6.62 | 6.69 | 6.51 | 6.79 | 6.39 | 8.26 | 6.54 | 6.57 | 6.37 | 6.50 | 2.91 (2.35) | 8.33 | 3.58 | |
| 49 | 4.29 | 6.93 | 4.37 | 4.39 | 4.07 | 4.06 | 4.86 | 8.22 | 5.19 | 5.24 | 5.02 | 4.84 | 4.87 | 6.97 | 4.77 | 4.82 | 4.71 | 4.66 | 1.32 (0.62) | 8.33 | 3.58 | |
The experimental Ki values (Obsd) are from Wadkins.27 Predicted Ki values for the classical QSAR are based upon Eq. (7a),Eq. (8a), and Eq. (9a) for gem-diol geometry and Eq. (7b),Eq. (8b), and Eq. (9b) for ketone geometry. Predicted Ki values for the 3D-QSAR are based upon Eq. (10a),Eq. (11a), and Eq. (12a) for gem-diol geometry and Eq. (10b),Eq. (11b), and Eq. (12b) for ketone geometry.
TFK structures are drawn as shown in Wadkins27, in which the hydration of the gem-diol/ketone is shown based upon 1H NMR observations. However, the compounds exist in a dynamic equilibrium between ketone and gem-diol in solution.
The log P value for the ketone is the first value and the gem-diol is given in parentheses.