Figure 2.
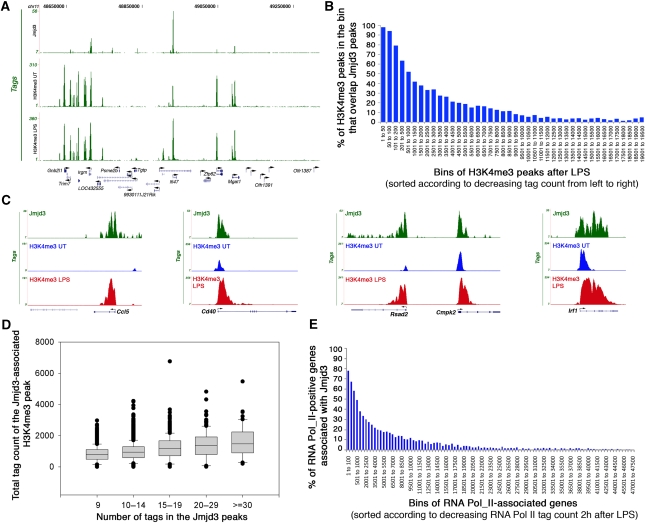
Jmjd3 association with transcriptionally active and inducible genes. (A) Jmjd3 association with H3K4me3-positive genes. Jmjd3 peaks and H3K4me3 peaks (in unstimulated and LPS-stimulated macrophages) at a representative region of chr 11 are shown. (B) Correlation between H3K4me3 levels and Jmjd3 binding in LPS-stimulated macrophages. H3K4me3 peaks were grouped in bins of decreasing total tag count from left to right. The y axis indicates the per cent of H3K4me3 peaks overlapping Jmjd3 peaks. (C) Association between Jmjd3 and H3K4me3 at representative genes. (D) Correlation between intensity of Jmjd3 binding and high levels of H3K4me3. (E) Correlation between Pol_II level and Jmjd3 binding at 2 h after LPS stimulation. Genes were grouped in bins of decreasing Pol_II intensity from left to right. The y axis shows the per cent of active, RNA Pol_II-positive genes that are associated with Jmjd3.

