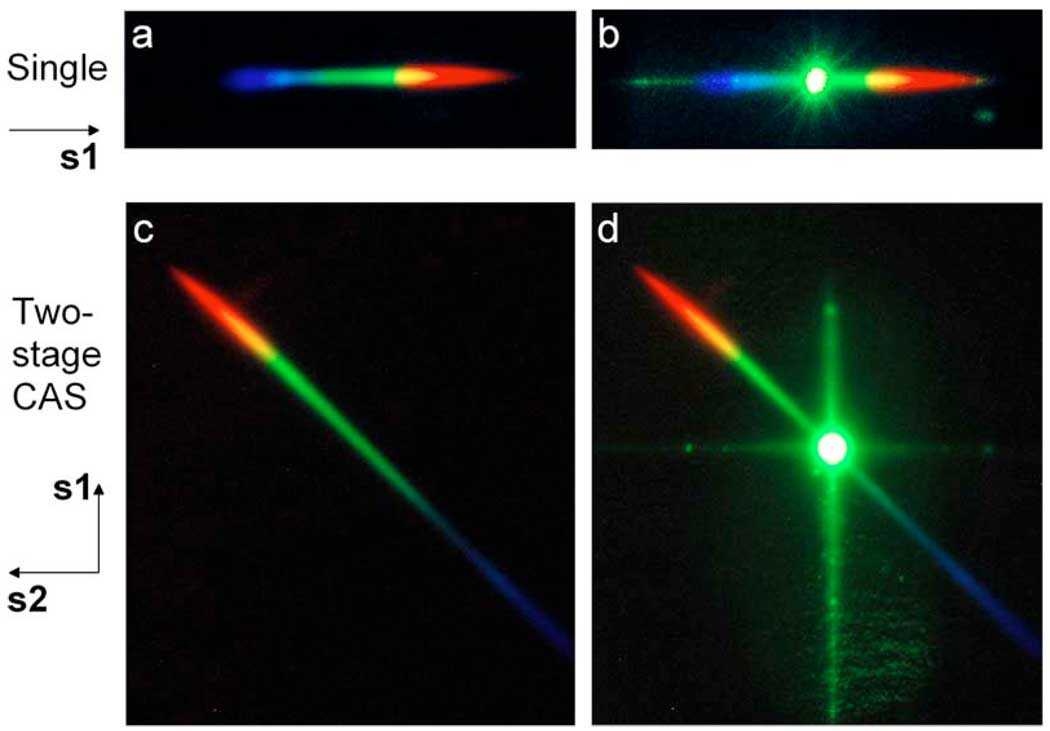
Fig. 3.
(Color online) Optical spectra in the two-stage cross-axis spectrograph. (a),(b) Spectra measured after Grating1 (a) with only LED light as an input and (b) with both LED and intense green laser light. Green stray light produced by Grating1 is overlapped with the rainbow spectrum. (c),(d) Spectra measured after Grating2 (c) with only the LED input and (d) with both the LED and laser. The stray light lies along the vertical and horizontal lines, easily separable from the spectrum along the oblique axis at about 45°.

