
Fig. 3.
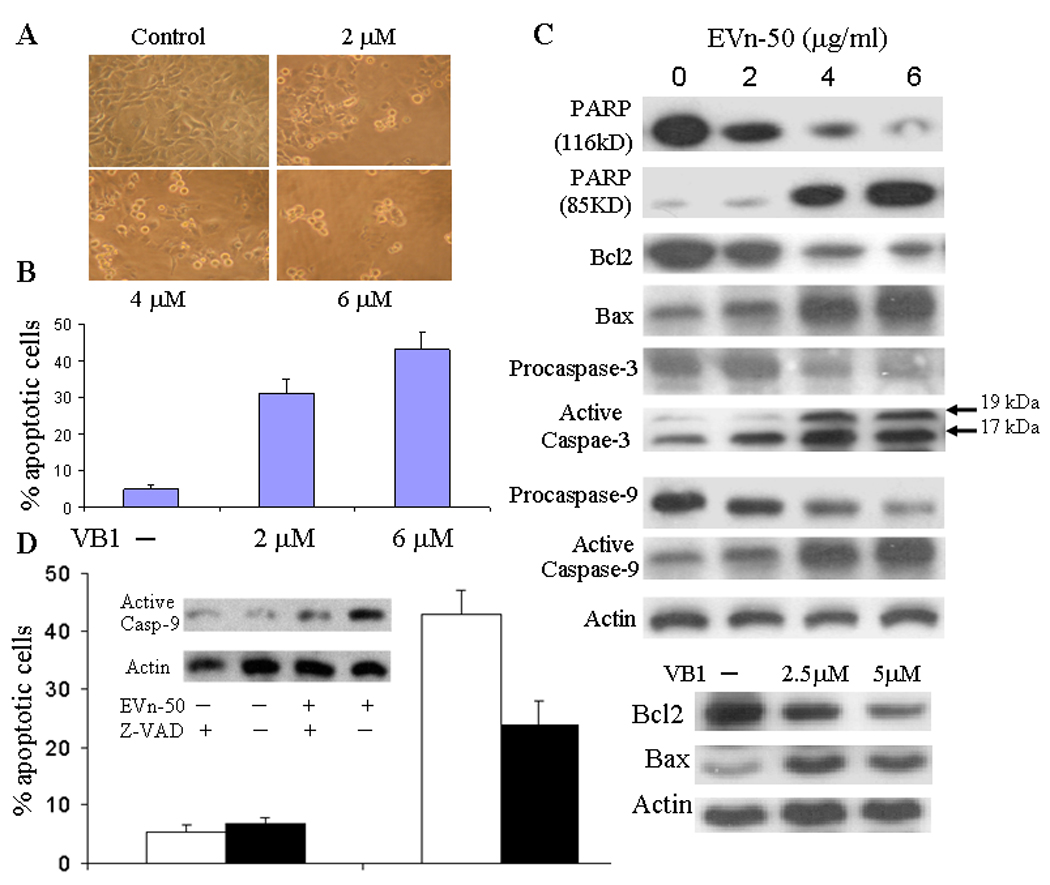
Induction of apoptosis and regulation of apoptotic biomarkers. A. Morphology of VB1 treated MDA-MB-231 cells. Cells were treated with VB1 at three doses as indicated for 48 hours. B. Analysis of apoptotic cells treated with or without VB1. MDA-MB-231 cells were treated VB1 for 48 hours and apoptotic cells were determined. The numbers represent means ± SD of three cultures. Statistical comparisons of treated vs. control indicate p < 0.001. C. Effects on apoptotic biomarkers. MDA-MB-231 cells were treated with EVn-50 or VB1 at different doses as indicated for 48 h. Equal amount of total cellular protein was subjected to Western analyses of PARP, cleaved PARP, Bcl-2, Bax, procaspase-3, active caspases-3, procaspase-9, and active caspases-9. D. Reversing EVn-50-indueced apoptosis by inhibiting caspases. MDA-MB-231 cells were pretreated with 12 µM of general caspases inhibitor Z-VAD-FMK for 2 h, followed by additional 48 h treatment with EVn-50 (5 µg/ml). Percentage of apoptotic cells were then determined. The numbers represent means ± SD of three cultures. Closed bars represent inhibitor treated cells and open bars represent non-treated cells. Inset is a Western blot for activated caspases-9.