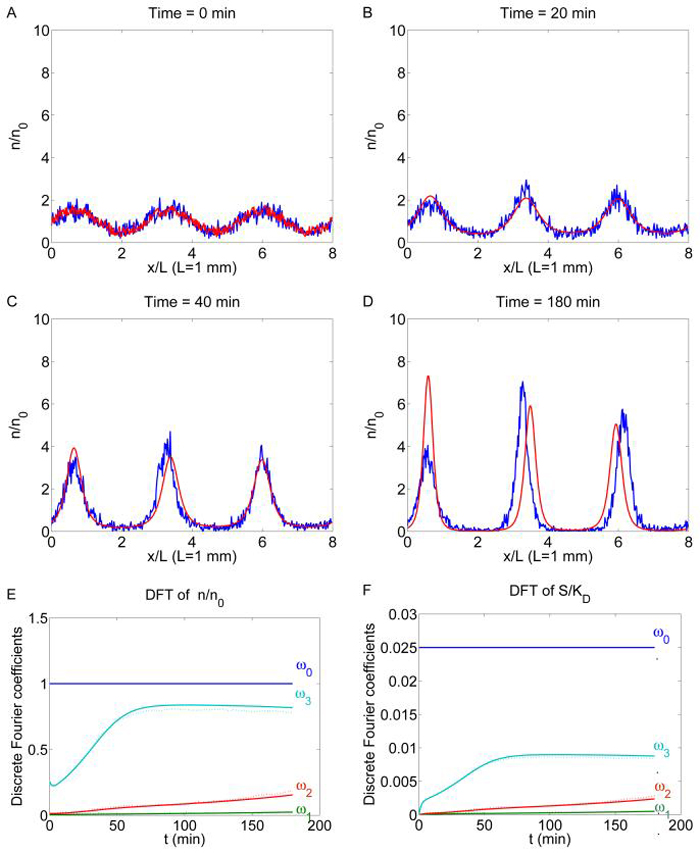
Fig. 4.3.
Multi-aggregate formation in bacterial colonies. In the top four plots, the time-lapse shots of the cell density obtained from the continuum model (red line) is compared with one realization of the stochastic simulation of the cell based model (blue line) with initial conditions (4.10, 4.11). In the bottom two plots, the amplitude of the first 4 Fourier modes of the solutions are compared. Smooth lines: solution of the PDE system; dotted lines: stochastic simulation. 8 × 10³ cells are used for the Monte Carlo simulation (n0 = 103). The same parameters are used as in Figure 4.2.

