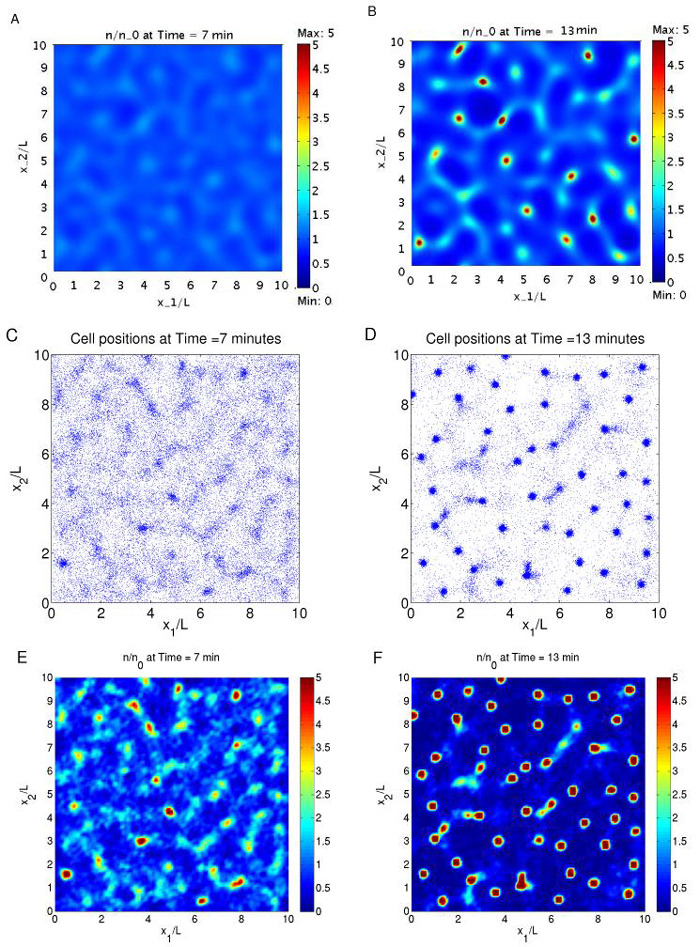
Fig. 4.4.
E. coli network and aggregate formation. (A), (B): the cell density from the continuum model (A: t = 7min, B: t = 13min); (C), (D): the positions of the cells calculated from the cell-based model at the same time points; (E), (F): the interpolated cell density from (C) and (D). Parameters used include λ0 = 1 s-1, b = 5 s-1, ta = 2 s, s = 20 μm/s, kd = 40, Ds = 8 × 10⁻⁴ mm2/s, μ = 1/3 × 10-2 s-1, γ = 1/6 × 10-1/n0 s-1, n0 = 400, L = 1mm.

