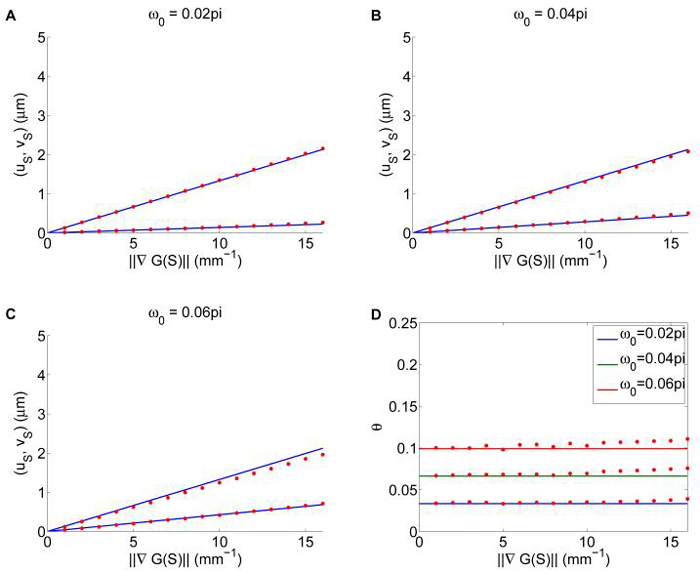
Fig. 5.1.
Comparison of the macroscopic velocity from equation (5.30, 5.32) with statistics from the cell-based model. In the first three plots, we compare (uS, vS) = (uS ⋅ ∇S uS ⋅ (∇S)⊥) as a function of ∇G(S) for ώ0 = 0.02π, 0.04π, 0.06π. Solid lines are computed from equation (5.30), dots are computed from the cell-based model; upper lines and dots are for uS , lower lines and dots are for vS. The fourth plot is a comparison of the predicted angle θuS,∇S by equation (5.32) with simulation at different parameters. All other parameters are the same as the previous examples.

