
Figure 4.
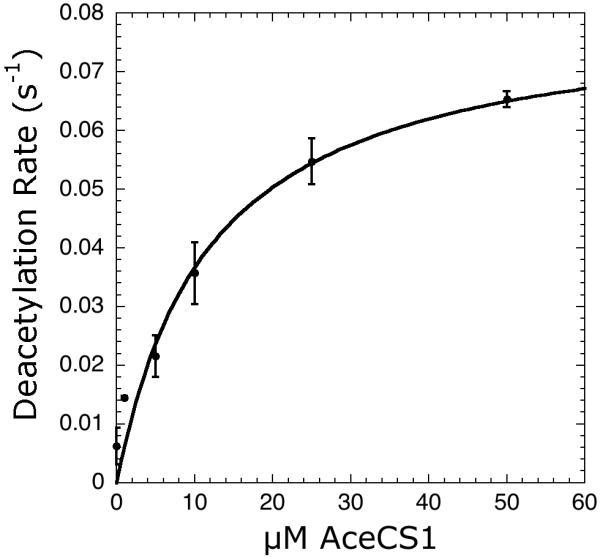
Steady-state kinetics of Sirt1 varying concentrations of native AceCS1. Reaction mixtures either contained 0-50 μM AceCS1 with 10 μM AcuA, 250 μM acetyl-CoA, in 750 μM NAD+, 0.2 mM NADPH, 1 mM DTT, 3.3 mM α-ketoglutarate, 2 μM MBP-PncA, ∼2 units of glutamate dehydrogenase from Proteus, 0.5 μM Sirt1 in 20 mM potassium phosphate at pH 7.5. Background rates measured in absence of the varied substrate were subtracted from the Sirt1 catalyzed reactions. To determine kcat and Km values, the plot of steady-state nicotinamide formation rates versus substrate concentration was fit to the Michaelis-Menten equation [v = ([E]0 kcat · [S])/(Km + [S])] using KaleidaGraph (Synergy Software, Reading, PA).